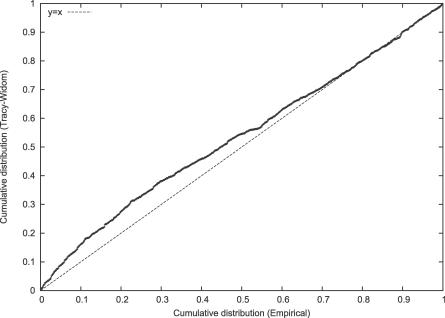
Figure 3. Testing the Fit of the Second Eigenvalue.
We generated genotype data in which the leading eigenvalue is overwhelmingly significant (FST = .01, m = 100, n = 5,000) with two equal-sized subpopulations. We show P–P plots for the TW statistic computed from the second eigenvalue. The fit at the high end is excellent.

