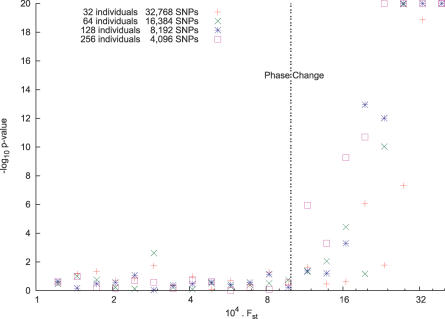
Figure 6. The BBP Phase Change.
We ran a series of simulations, varying the sample size m and number of markers n but keeping the product at mn = 220. Thus the predicted phase change threshold is FST = 2−10. We vary FS and plot the log p-value of the Tracy–Widom statistic. (We clipped −log10 p at 20.) Note that below the threshold there is no statistical significance, while above threshold, we tend to get enormous significance.

