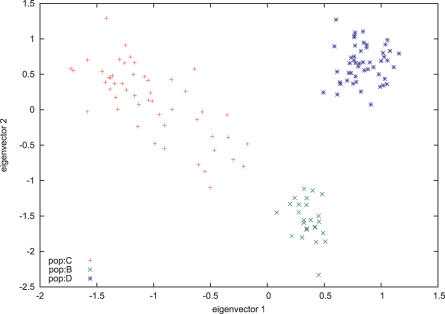
Figure 8. A Plot of a Simulation Involving Admixture (See Main Text for Details).
We plot the first two principal components. Population C is a recent admixture of two populations, B and a population not sampled. Note the large dispersion of population C along a line joining the two parental populations. Note the similarity of the simulated data to the real data of Figure 5.

