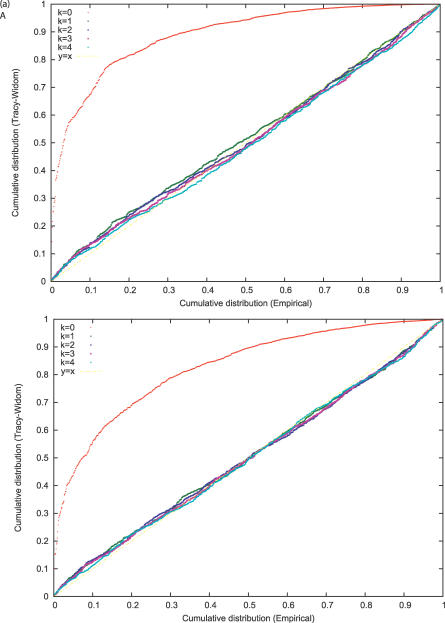
Figure 10. LD Correction with Strong LD.
(A) Shows P–P plots of the TW statistic (m = 100, n = 5,000) with large blocks of complete LD. Uncorrected, the TW statistic is hopelessly poor, but after correction the fit is again good. Here, we show 1,000 runs with the same data size parameters as in Figure 2A, m = 500, n = 5,000, varying k, the number of columns used to “correct” for LD. The fit is adequate for any nonzero value of k.
(B) Shows a similar analysis with m = 200, n = 50,000.

