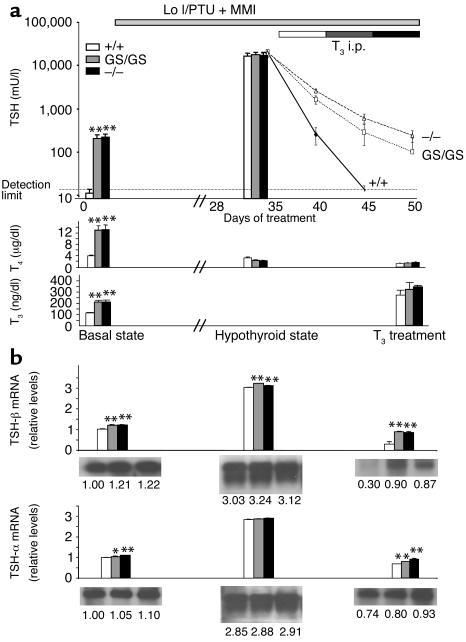
Figure 3.
Effect of thyroid hormone deficiency and excess on regulation of the H-P-T axis. (a) Serum TSH levels were sequentially determined in TR-β+/+ (white bar, solid line), TR-βGS/GS (gray bar, dotted line), and TR-β–/– mice (black bar, dashed line) at the baseline, after Lo I/PTU diet+MMI water for 5 weeks, and with the additional treatment with different doses of L-T3 for 5 days each (top). TSH detection limit was less than 25 mU/l. Serum T4 (center) and T3 (bottom) levels were also measured. Five animals were evaluated in each group, and data are shown as means ± SEM. (b) TSH-β (top) and common-α subunit (bottom) mRNA levels in the anterior pituitary of TR-β+/+, TR-βGS/GS, and TR-β–/– mice using a Northern blot analysis. Each Northern blot was rehybridized with cyclophilin probe as a control, and data were normalized for each mRNA level relative to the basal state of WT animals. *P < 0.05, **P < 0.01. i.p., intraperitoneal.

