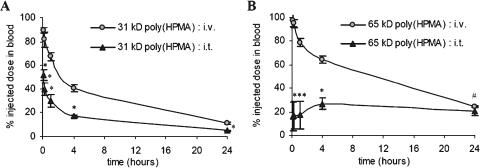
Figure 1.
Effect of i.t. injection on the circulation kinetics of HPMA copolymers. The blood concentrations of 31-kDa poly(HPMA) (A) and 65-kDa poly(HPMA) (B) after i.v. and i.t. injection are plotted against time. Values represent the average ± SD of four to six animals per experimental group. *P < .0001 vs i.v. injection. #P < .05 vs i.v. injection (Student's t test).

