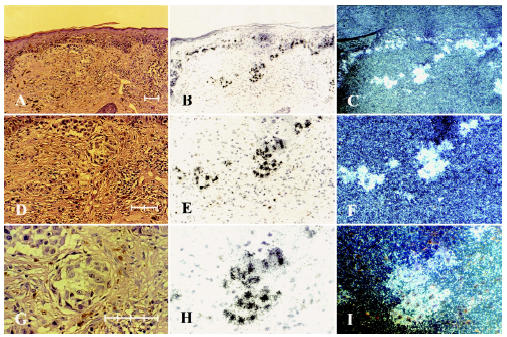
Figure 2.

In situ hybridization of primary melanoma Clark IV. A, D and G are stained with hematoxylin and eosin; B, E and H are labeled with radioactive hTR stained with hematoxylin and visualized under bright field microscopy; C, F and I are labeled with radioactive hTR and visualized under dark field microscopy. (A–C are at 100 x final magnification; D – F 200 x final magnification; and G – I 400 x final magnification; Scale bars: A = 80 µm, D = 85 µm, and G = 75 µm).
