
Figure 4.
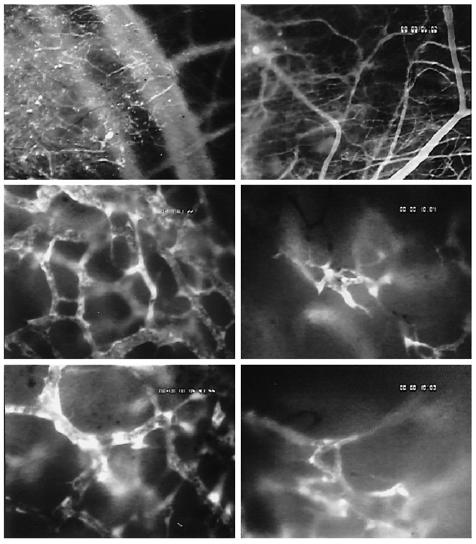
C6 glioma microvasculature in animals treated with DMSO (50 µL/d, IP; left row) or SU5416 (25 mg/kg/d, IP; right row) on day 6 (top panels) and 18 (middle and bottom panels) after glioma cell implantation. Intravital multi-fluorescence videomicroscopy, contrast enhancement with 2% FITC-dextran150 IV.