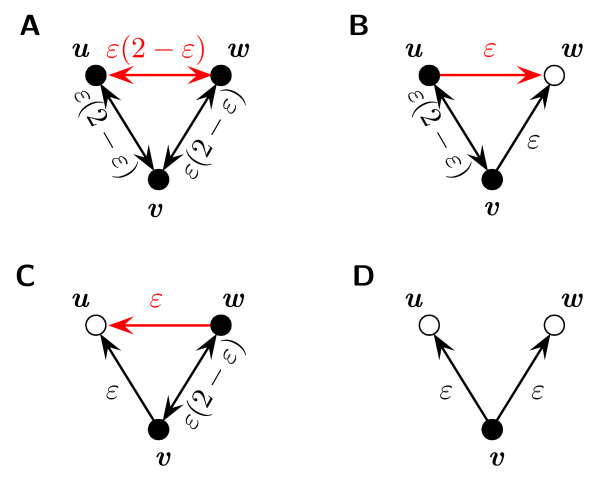
Figure 3.
Effect of sampling on baits. Here, the probabilities for selecting edges are shown for the case that v is a bait. The notation is the same as in Figure 2. For each possible bait-prey combination of u and w, the probabilities are shown separately. The edge completing the triangle and the corresponding probabilities for selecting this edge are shown in red.

