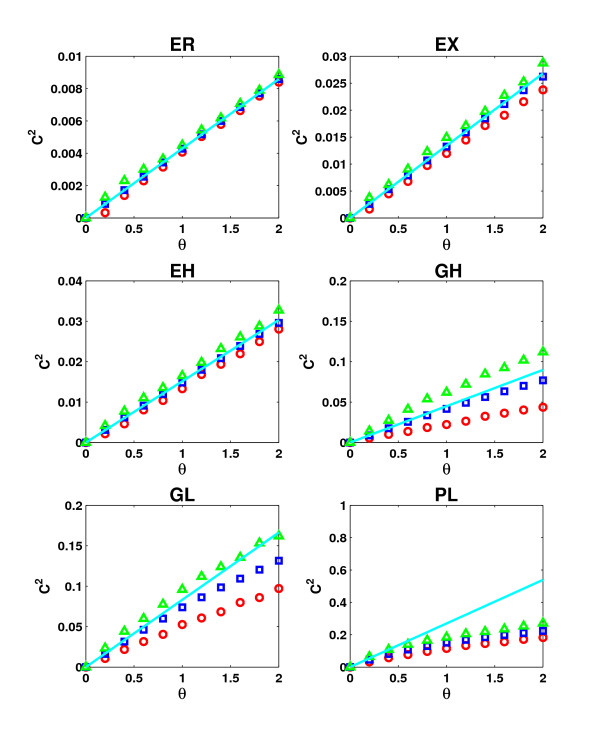
Figure 6.
Comparison between approximation and simulation of false positive interactions. The minium (red), average (blue) and maximum (green) clustering coefficients obtained in 50 simulations of false positive interactions with β = 1 and ε = 0 are compared against the clustering coefficients predicted by the approximation 2θξ for networks of average degree 10. Topology models are sorted according to increasing skewness from top left to bottom right to illustrate the increasing deviation from the approximation with network skewness.

