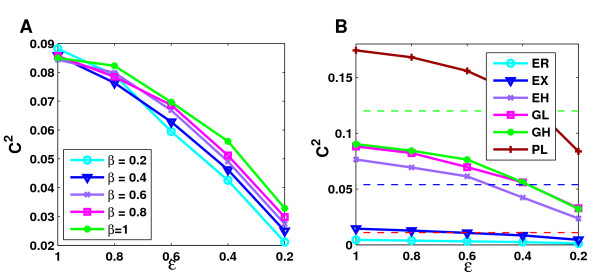
Figure 9.
Clustering coefficients at a fixed false positive rate. The combined effect of the different error mechanisms were analyzed by setting the false positive rate at a fixed value of 50%. For each combination of β and ε, θ was then chosen accordingly. A shows the resulting clustering coefficients at different bait coverage rates for the GL networks and B for each topology the maximum over the averages obtained for the different values of β considered. Minimum, average and maximum clustering coefficients observed in the real Y2H experiments are indicated by red, blue and green dashed lines.

