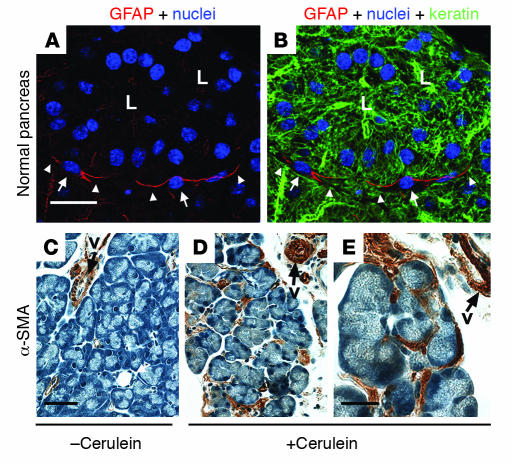
Figure 2. Immune staining of PaSCs.
(A and B) Normal mouse pancreas was triple stained to visualize GFAP (red), nuclei (blue), and keratin polypeptide 8 (green). L, lumen; arrows point to PaSC nuclei and arrowheads point to PaSC processes. (C–E) Pancreata from plasminogen-deficient mice injected with saline (C) or with cerulein to induce pancreatitis (D and E) were stained with antibodies specific for α-SMA as described previously (61). The image shown in E is a higher magnification of that shown in D. Note the dramatic induction of α-SMA in activated PaSCs that surround or are located between acini. Arrows point to blood vessel (v) staining. Scale bars: 20 μm (A and B), 50 μm (C and D), and 20 μm (E).

