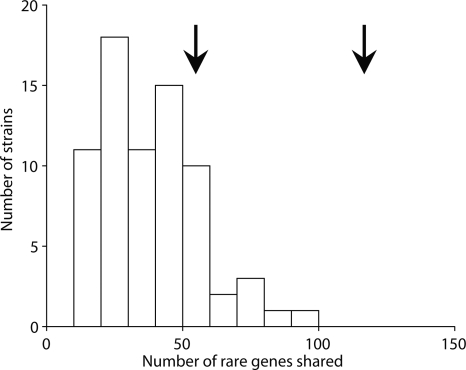
Figure 3.
Histogram of the number of rare genes (as defined in the main text) shared by Typhi CT18 and other strains of S. enterica. The arrow at 120 shows the number of genes shared between Typhi and Paratyphi A while the arrow at 55 shows the projected number of genes if the whole genome had the same frequency of rare genes as the high-divergence regions. Note that we have excluded the large SPI7 region, which is shared between Typhi and a handful of other strains. The data is from Porwollik et al. (2004).

