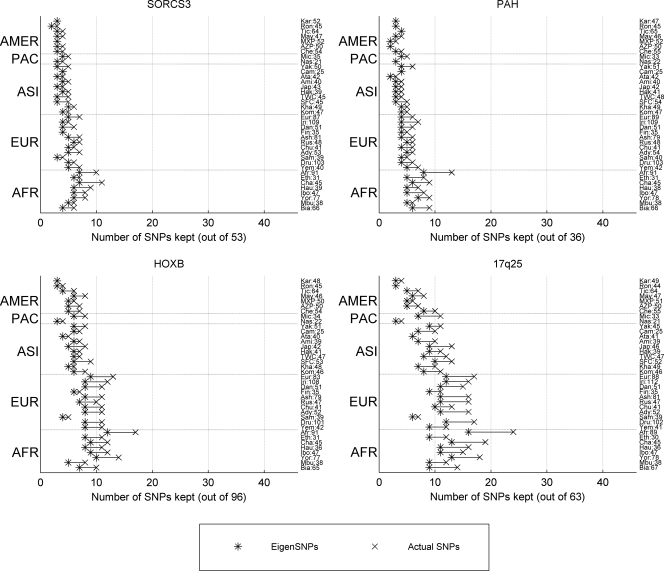
Figure 1.
Number of eigenSNPs (computed with the SVD) and actual SNPs (computed with the tSNPsMultiPassGreedy algorithm) explaining 90% of each population’s spectral variance. The number of individuals in each population sample is denoted next to the population’s abbreviation. Populations are ordered (bottom to top) based on geographic regions (abbreviations used are shown in parentheses). Africa: Biaka (Bia), Mbuti (Mbu), Yoruba (Yor), Ibo (Ibo), Hausa (Hau), Chagga (Cha), Ethiopian Jews (Eth), African Americans (Afr), South-west Asia and Europe: Yemenites (Yem), Druze (Dru), Samaritans (Sam), Adygei (Ady), Chuvash (Chu), Russians (Rus), Ashkenazi Jews (Ash), Finns (Fin), Danes (Dan), Irish (Iri), European Americans (Eur), Asia: Komi (Kom), Khanty (Kha), Chinese Han-San Francisco (SFC), Chinese-Taiwan (TWC), Hakka (Hak), Japanese (Jap), Ami (Ami), Atayal (Ata), Cambodians (Cam), Yakut (Yak), Pacific: Nasioi (Nas), Micronesians (Mic), America: Cheyenne (Che), Pima-Arizona (AZP), Pima-Mexico (MXP), Maya (May), Ticuna (Tic), Rondonian Surui (Ron), Karitiana (Kar).

