Abstract
Cadherin cell adhesion molecules exhibit unique expression patterns during development of the vertebrate central nervous system. In this study we obtained a full-length cDNA of a novel zebrafish cadherin using reverse transcriptase-polymerase chain reaction (RT-PCR) and 5′ and 3′ rapid amplification of cDNA ends (RACE). The deduced amino acid sequence of this molecule is most similar to the published amino acid sequences of chicken and mammalian cadherin7 (Cdh7), a member of the type II cadherin subfamily. cadherin7 message (cdh7) expression in embryonic zebrafish was studied using in situ hybridization and RT-PCR methods. cdh7 expression begins at about 12 hours post fertilization (hpf) in a small patch in the anterior neural keel, and along the midline of the posterior neural keel. By 24 hpf, cdh7 expression in the brain shows a distinct segmental pattern that reflects the neuromeric organization of the brain, while its expression domain in the spinal cord is continuous, but confined to the middle region of the spinal cord. As development proceeds, cdh7 expression is detected in more regions of the brain, including the major visual structures in the fore- and midbrains, while its expression domain in the hindbrain becomes more restricted, and its expression in the spinal cord becomes undetectable. cdh7 expression becomes reduced in 3-day old embryos. Our results show that cdh7 expression in the zebrafish developing central nervous system is both spatially and temporally regulated.
Keywords: zebrafish, development, cell adhesion molecules, brain, spinal cord, visual system
1. Results and Discussion
Zebrafish has become as an important model system to study vertebrate neural development, due to its numerous experimental advantages including external embryonic development, transparency of the embryos, and its demonstrated utility as a genetic model. Similar to other vertebrate animals, development of zebrafish central nervous system (CNS) involves partitioning of the anterior portion of the neural tube into three vesicles called the forebrain, midbrain and hindbrain. Subsequently, the forebrain is further divided to smaller units, the telencephalon and diencephalon (reviewed by Kimmel, 1993).
The molecular mechanisms underlying the regionalization of the vertebrate CNS have been under intense investigation. Specific regulatory molecules (Puelles and Rubenstein, 1993; Macdonald et al., 1994; Mastick et al., 1997; Hauptmann and Gerster, 2000; Andermann and Weinberg, 2001) and cell adhesion molecules including members of the cadherin superfamily (Inoue et al., 1997, 1998, 2001; Redies, 1997, 2000; Heyers et al., 2003) have been implicated in the formation of these structures.
Cadherins are a large family of cell adhesion molecules that include the classic cadherins (type I), atypical cadherins (type II), protocadherins, desmosomal cadherins, and Flamingo cadherins (Nollet et al., 2000). Most cadherins are transmembrane proteins that mediate cell adhesion mainly through homotypic interactions (Takeichi, 1991; Gumbiner, 1996). The type I classic cadherins have a conserved His-Ala-Val (HAV) sequence in their extracellular domain one (EC1), and share a high degree of amino acid sequence similarity to E-cadherin (cadherin1), while the type II cadherins do not contain HAV in their EC1, and they are more similar in protein sequence to cadherin11 (reviewed by Nollet et al., 2000). Studies of several classic cadherin molecules (e.g. cadherin2 and cadherin4, also known as N- and R-cadherin respectively) reveal that these molecules play essential roles in the development of the vertebrate CNS (Radice et al., 1997; Lele et al., 2002; Treubert-Zimmermann et al., 2002; Malicki et al., 2003; Masai et al., 2003; Babb et al., 2005). Cdh7 is a member of the type-II cadherin subfamily (Redies, 1997; Nollet et al., 2000). So far, Cdh7/cdh7 expression pattern has been examined in chicken central nervous system (Becker and Redies, 2003; Heyers et al., 2003; Ju et al., 2004; Luo et al., 2004), and in human total RNA from various tissue samples (Kools et al., 2000). There are no published reports on Cdh7/cdh7 expression in fish. Zebrafish cdh7 cDNA sequence and deduced amino acid sequence, predicted by automated computational analysis, were recently published in GenBank (accession number: XM 691001).
To confirm the predicted GenBank zebrafish cdh7, we performed RT-PCR, 5′ and 3′ RACE using total RNA from 50 hours post fertilization (hpf) zebrafish embryos and zebrafish cdh7 specific primers (see Experimental procedures). These experiments revealed that our sequence could only be aligned with the nucleotides from 5892 to 7780 of the GenBank sequence (accession No. DQ 411036). The GenBank sequences before and after this region showed no similarity to any cadherin molecules, suggesting that this sequence was incorrectly assembled with unrelated gene sequences.
The resulting open reading frame produces a protein of 787 amino acid residues containing a putative hydrophobic signal sequence, presequence, extracellular domains, transmembrane and cytoplamic domains (Fig. 1). The imputed start codon was identified because (1) it was the first methionine codon following a 484-nucleotide 5′-untranslated sequence; (2) a canonical signal sequence follows this methionine codon; (3) the presequence (including the signal sequence) found in our clone is similar in length (43 amino acid residues) to presequences from other Cdh7 and type II cadherin sequences (from mouse, chicken and human), while presequences in type I cadherins (e.g. Cdh1, Cdh2 and Cdh4) are much longer (about 150 amino acids). An alignment of related cadherin sequences shows that the zebrafish cdh7 is most similar to human, mouse, and chicken cdh7 at the amino acid level, while showing little similarity to cdh1, a type-I classic cadherin (Fig. 2A and B). The complete coding sequence for the zebrafish cdh7 gene was deposited in GenBank (Accession No. DQ_411036)
Figure 1.
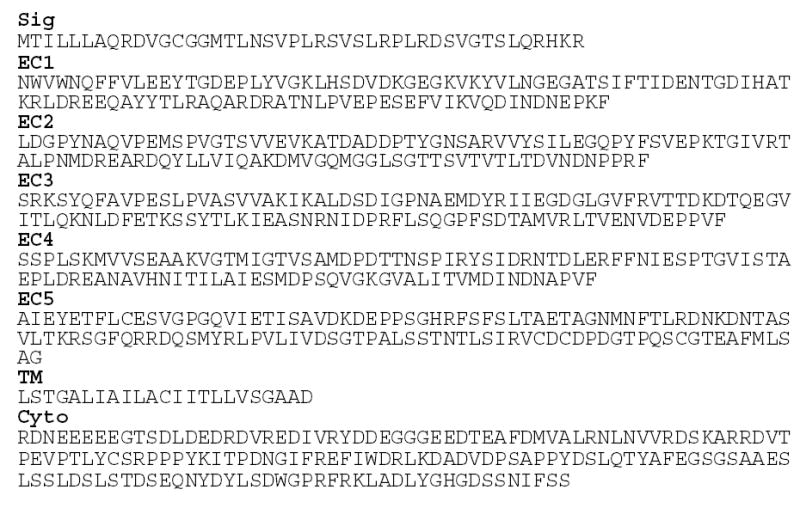
Deduced amino acid sequence of zebrafish Cdh7. The putative hydrophobic signal sequence (Sig) is underlined. Other abbreviations: cyto, cytoplasmic domain; EC1-EC5, extracellular domains 1–5; TM, transmembrane domain.
Figure 2A.
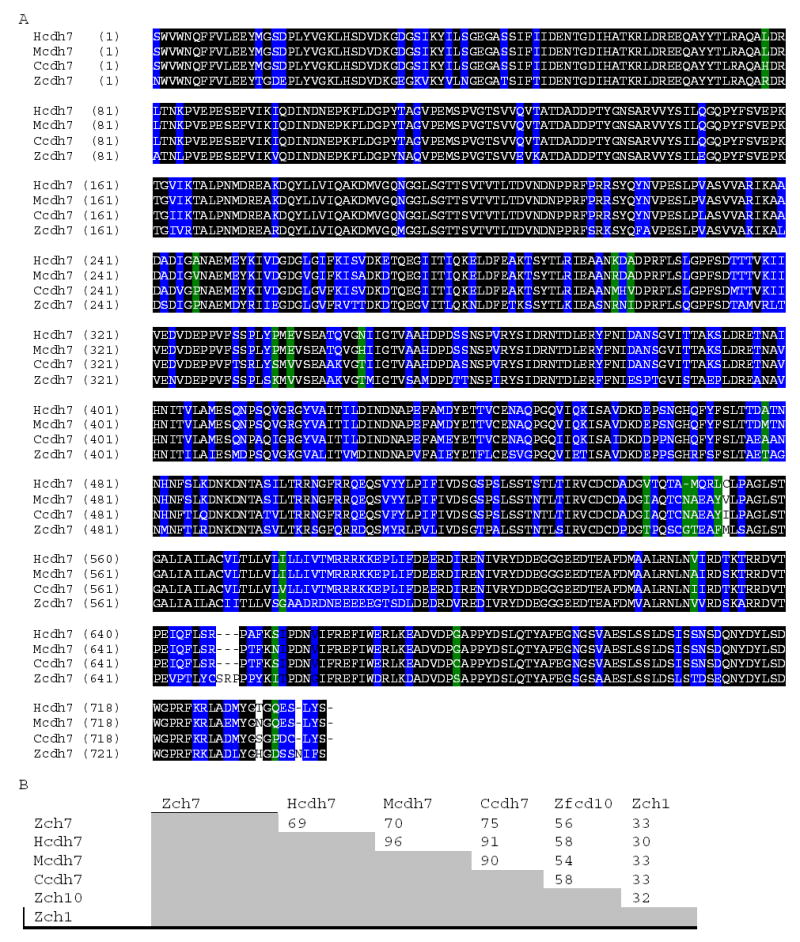
Amino acid sequence comparison between the deduced zebrafish Cdh7 amino acid sequence (Zcdh7), chicken Cdh7 (Ccdh7), human Cdh7 (Hcdh7) and mouse Cdh7 (Mcdh7). Comparisons were between published sequences from the EC1 to near the end of the coding sequences. Residues that are identical among all 4 sequences are outlined in black. Residues conserved in 3 of 4 sequences are outlined in blue, while 2 of 4 outlined in green. Figure 2B shows sequence identity percentages for pairwise comparisons between zebrafish Cdh7, several other Cdh7 sequences, cadherin10 (Zcdh10, another type II zebrafish cadherin), and a type I zebrafish cadherin, cadherin1 (Zcdh1). Sequence comparisons were performed using Clustal W (Des Higgins, EBI, Hinxton Hall, UK).
Using RT-PCR and whole mount in situ hybridization methods, we analyzed expression of cdh7 in embryonic zebrafish from 2 hpf to 70 hpf. PT-PCR experiments revealed that cdh7 transcripts were absent from early embryos, and became detectable in older embryos (Fig. 3). Strong cdh7 expression was detected at 24 hpf and 50 hpf, and it became reduced in 3-day old embryos (70 hpf). Whole mount in situ hybridization experiments showed that at 12 hpf, cdh7 expression was detected in a small patch located immediately caudal to the eye primordium in the anterior neural keel (Fig. 4A and B). At a distance approximately the two times the anteroposterior length of the eye primordium from the first expression domain, cdh7 expression was found along the midline throughout the rest of the neural keel (Fig. 4B and C). By 18 hpf, six cdh7 expression domains were identified in the brain regions anterior to the caudal boundary of the cerebellum (Fig. 4D and E). The most anterior expression domain was in the telecephalon, anterodorsal to the optic recess. There were two closely located expression domains in the ventral diencephalon, while three expression domains almost equally spaced were found in the presumptive midbrain and mid-hindbrain regions (Fig. 4E). In the hindbrain, cdh7 was detected throughout the ventral half of this region (Fig. 4D and F). Expression levels, judging by staining intensities, varied in the hindbrain. cdh7 expression was weaker in the hindbrain region at the level of the otic placode (Fig. 4F–H). cdh7 expression continued in the spinal cord (Fig. 4D and I). The notochord was also cdh7 positive (Fig. 4I).
Figure 3.
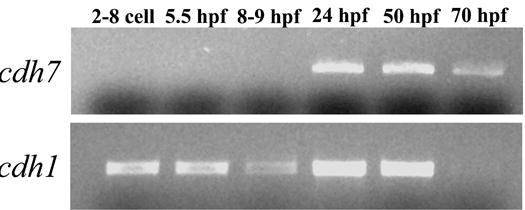
RT-PCR analysis of cdh7 expression in embryonic zebrafish using total RNAs. RT-PCR for cdh1 was performed as loading control.
Figure 4.
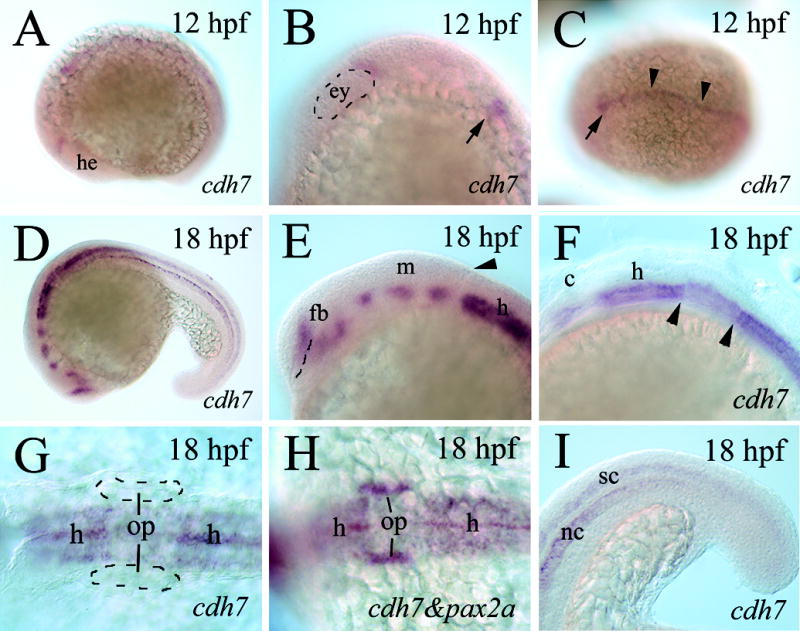
cdh7 expression in 12–18 hpf zebrafish embryos. All panels, except panels C, G and H, show lateral views of whole mount embryos (anterior to the left and dorsal up) labeled with either cdh7 cRNA (panels A–G, and I) or cdh7 and pax2a cRNA probes (panel H, both probes were digoxigenin-labeled). Panel B is a higher magnification of the head region of the embryo with the eye primordium outlined by the dashed line. Panel C is a dorsal view (anterior to the left) of the embryo. The arrows in panel B and C point to the same cdh7 expression region in the hindbrain, while arrowheads in panel C indicate cdh7 expression at the midline. Panels E–G are higher magnifications of the head region, while panel I is a higher magnification of the tail region. The dashed line in panel E indicates the optic recess, while the arrowhead points to the caudal boundary of the cerebellum. The pair of arrowheads in panel F bracket a hindbrain region with reduced cdh7 expression. Panels G and H are dorsal views (anterior to the left) of higher magnifications of the hindbrain region of the embryos showing that the region with the reduced cdh7 expression is at the level of the otic placode. The otic placodes in panel G are outlined with dashed lines. Abbreviations: c, cerebellum; ey, eye premordium; h, hindbrain; he, head region; nc, notochord; op, otic placode; sp, spinal cord.
The major divisions of the zebrafish brain become readily discernable by 24 hpf (Kimmel, 1993; Ross et al., 1992). cdh7 expression at this stage in the fore- and midbrains was similar to 18 hpf embryos (Fig. 5). To determine the relative positions of the cdh7 expression domains, we performed two types of double labeling experiments. In the first type of double-labeling experiments, cdh7 in situ hybridization was followed by immunohistochemistry using a monoclonal antibody zn12 that labels L2/HNK-1 tetrasaccharide expressed by several early differentiated neurons and their axonal processes (Trevarrow et al., 1990; Ross et al., 1992; Andermann and Weinberg, 2001). Results from these experiments showed that the cdh7 expression domain in the telencephalon overlapped with the anterior commissure (Fig. 5B–D), and appeared to occupy the same place as the dorsorostral cluster described by Ross et al. (1992). The two closely located cdh7 expression domains in the ventral diencephalon (asterisks in Fig. 5B and D) were situated mainly dorsocaudal to the tract of the postoptic commissure, while the two midbrain cdh7 expression domains (arrowheads in Fig. 5B and D) were located dorsomedial to the ventrocaudal cluster described by Ross et al. (1992). Examination of sections from embryos processed for the whole mount in situ hybridization revealed that the cdh7 expression domains in the diencephalon (Fig. 5E) had less defined borders than the first midbrain expression domain (Fig. 5F).
Figure 5.
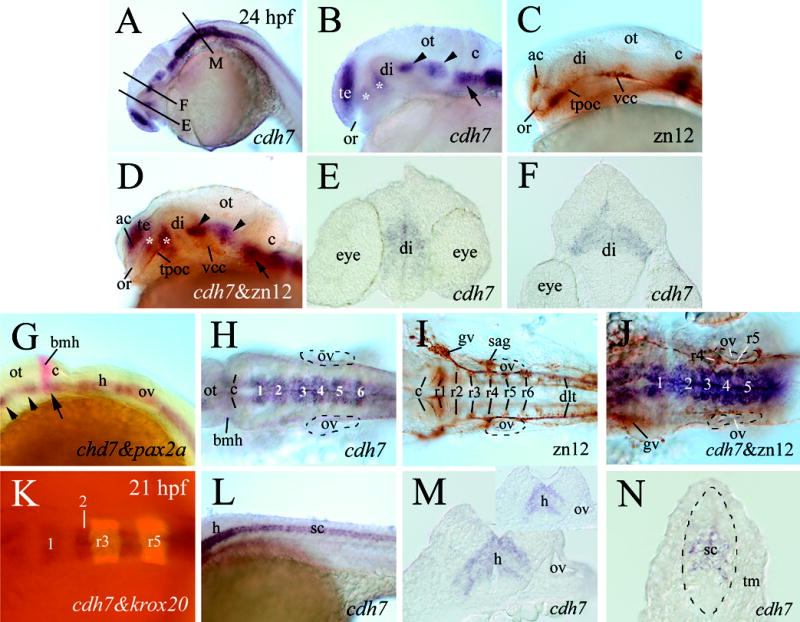
cdh7 expression in 24 hpf zebrafish embryos (panel K is from 21 hpf). Zebrafish embryos processed for cdh7 whole mount in situ hybridization are shown in panels A, B, E, F, H, L–N. Panels C and I show embryos processed for zn12 whole mount immunostaining, while panels D and J show embryos processed for double-labeling (cdh7 in situ hybridization (purple) followed by zn12 immunostaining (brown)). Panel G is from a double-labeling experiment using digoxigenin-labeled cdh7 (purple) and fluorescein-labeled pax2a (red) cRNA probes. Panel K shows an embryo processed for double-labeling experiment using the digoxigenin-labeled cdh7 probe (dark) and fluorescein-labeled krox20 probe (fluorescent). Panels A–D, and G are lateral views of the head region with anterior to the left and dorsal up. Panels E, F, M and N are cross sections (dorsal up) from embryos processed for cdh7 whole mount in situ hybridization. Asterisks in panels B and D indicate cdh7 expressing domains in the diencephalon. Arrowheads and arrows in panels B–D and G indicate corresponding cdh7 expressing domains in the mid- and hindbrains. The section levels of panels E, F and M are indicated by corresponding letters in panel A. Panels H–K are dorsal views (anterior to the left) of higher magnification of the hindbrain region. The otic vesicles in panels H–J are outlined by dashed lines. The white numbers in panels H, J and K label swellings of cdh7 expression in the hindbrain. Panel M shows a section from a swelling in cdh7 expression in the hindbrain at the otic vesicle level, while the insert in panel M shows a section from a restriction in cdh7 expression in a similar region. Panel L is a lateral view of the mid-trunk region of the embryo. The spinal cord region in panel N is outlined by the dashed line. Abbreviations: ac, anterior commissure; bmh, boundary of the mid- and hindbrains; di, diencephalon; gv, trigeminal ganglion; ot, optic tectum; ov, otic vesicle; r1–r6, rhombomeres 1–6; sag, statoacoustic ganglion; te, telencephalon; tm, trunk muscles; tpoc, tract of postoptic commissure; vcc, ventrocaudal cluster. Other abbreviations are the same as in Figure 4.
In the second type of double-labeling experiments, cdh7 (digoxigenin-labeled) and pax2a (fluorescein-labeled) cRNA probes (pax2a labels the boundary between the mid- and hindbrains and the otic placodes at this stage in zebrafish; Krauss et al., 1991) were used to determine the position of the third cdh7 expression domain (Fig. 4E, arrow in Fig. 5A, D and G) in the mid-hindbrain region. The anterior boundary of this cdh7 expression domain coincided with the boundary between the mid- and hindbrains (Fig. 5G). This cdh7 expression domain, separated from cdh7 expression domain in the hindbrain of younger embryos (Fig. 4E), became continuous (viewing laterally) with the cdh7 expression domain in the hindbrain (Fig. 5B, D and G). cdh7 expression in the rest of the hindbrain, although continuous, was confined to the medial region along the midline and composed of six swellings of approximately equal size viewing dorsally (Fig. 5H). Positions of these swellings in relation to the rhombomeres were determined using the first type of double labeling experiments described above. zn12 positive neurons and their processes in the hindbrain occupy the central region of each rhombomere (Fig. 5I). The cdh7 expressing swellings appeared to be located between clusters of zn12 positive cells and processes (Fig. 5J), suggesting that the swellings were situated at about half rhombomere width caudal to their corresponding rhombomeres. This was further confirmed by double-labeling the embryos using fluorescein-labeled krox20 (detects rhombomeres 3 and 5; Oxtoby and Jowett, 1993). Slightly younger embryos (21 hpf, Fig. 5K) were used because krox20 staining in the hindbrain is much reduced at 24 hpf compared to younger embryos (9-21 hpf, Oxtoby and Jowett, 1993). The width of the second cdh7 expressing swelling was about ½ of the krox20 expressing rhombomere 3 or rhombomere 5, suggesting that the cdh7 expression swellings partially overlapped with the rhombomeres (Fig. 5K). Examination of cross sections from the cdh7 expressing swellings (Fig. 5M) or constrictions (Fig. 5M insert) in the hindbrain revealed that cdh7 expression was confined to the mid-central region with sharp boundaries, with no cdh7 expression in the medioventral and dorsolateral hindbrain regions. cdh7 continued to be expressed throughout the entire length of the spinal cord, and similar to the hindbrain, its expression was confined to the mid-central region (Fig. 5L and N).
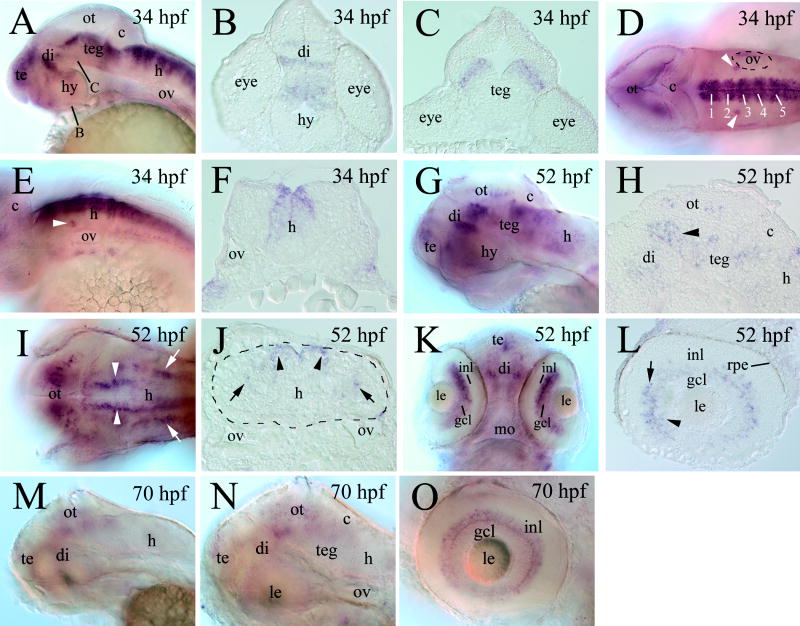
By 34 hpf, cdh7continued to be found in similar regions in the brain as in the younger embryos: in most part of the telencephalon, in distinct regions of the diencephalon (in the middle region, Fig. 6A and B), tegmentum (dorsal region, Fig. 6C), and hindbrain (see below). cdh7 continued exhibiting a segmental expression pattern in the hindbrain (Fig. 6D), although this expression domain appeared to become more restricted to the dorsomedial hindbrain (Fig. 6F). cdh7 was also found in a pair of small clusters of cells anterodorsal to the otic vesicle (Fig. 6D and E).
Figure 6.
cdh7 expression in 34 hpf (panels A–F), 52 hpf (panels G–L) and 70 hpf (panels M–O) zebrafish embryos. Panels A, D, E, G, I, K, M–O are from whole mount embryos processed for cdh7 in situ hybridization, while the remaining panels are sections from embryos processed for cdh7 whole mount in situ hybridization. Panels A, G, M and N are lateral views of the head region (anterior to the left and dorsal up). Panels B and C are cross sections (dorsal up) of the brain, with their section levels indicated by corresponding letters in panel A. Panels D and I are dorsal views (anterior to the left), while panel E is a lateral view (anterior to the left and dorsal up) of the hindbrain region. The white numbers in panel D indicate cdh7 expression swellings in the hindbrain. The arrowheads in panels D and E point to a pair of cdh7 expressing cell clusters in the ventral region anterodorsal to the otic vesicle. Panel F is a cross section (dorsal up) from the hindbrain. Panel H is a higher magnification of parasagittal section of the midbrain region. The arrowhead indicates cdh7 expressing cells in the pretectal region. The pair of arrowheads in panel I point to the dorsomedially located cdh7 expression domains, while the arrows indicate the ventrolaterally situated expression domains. Panel J is a cross section (dorsal up) from the hindbrain also showing the same cdh7 expressing domains (indicated by corresponding arrowheads and arrows) as in panel I. The hindbrain boarder in this panel is outlined by the dashed line. Panel K is a ventral view (anterior up) of the forebrain and eyes, while panel L is a parasagittal section (anterior to the left and dorsal up) of the retina. Panel N is a higher magnification of the head region in panel M, while panel O (anterior to the left and dorsal up) shows a lateral view of the eye. Abbreviations: gcl, retinal ganglion cell layer; hy, hypothalamus; inl, inner nuclear layer; mo, mouth; rpe, retinal pigmented epithelium; teg, tegmentum. Other abbreviations are the same as in previous figures.
By 52 hpf, cdh7 expression in the fore- and midbrains became increased (Fig. 6G). In addition to be detected in regions described above, cdh7 was also expressed by visual structures, the pretectal region, the optic tectum (Fig. 6G and H), and the retina (Fig. 6K and L). All cdh7 expression retinal cells were confined to the retinal ganglion cell layer and the inner most layer of the inner nuclear layer where retinal ganglion cells and amacrine cells, respectively reside. There appeared to be more labeling in the inner nuclear layer than the retinal ganglion cell layer (Fig. 6L). At this stage, cdh7 expression in the dorsomedial hindbrain became more restricted (Fig. 6I and J), and no longer showing a segmental expression pattern (Fig. 6I). cdh7 expression was also detected in the mediolateral hindbrain (Fig. 6G, I and J). By 3 days (70 hpf) of development, cdh7 expression continued in similar brain and retinal regions as in younger embryos, but its expression levels were reduced (Figs. 3, 6M–O).
cdh7 expression in the embryonic zebrafish is similar to that in chicken and humans, where its expression is found in the embryonic brain, and is developmentally regulated (Kools et al., 2000; Heyers et al., 2003). As in the developing chicken, cdh7 expression in the zebrafish retina is detected in the retinal ganglion cells and amacrine cells (Wöhrn et al., 1998). But unlike the chicken retina in which cdh7 expression is also found in the outer half of the inner nuclear layer (Wöhrn et al., 1998), while cdh7 expression in the zebrafish retina is confined to the retinal ganglion cell layer and the inner most portion of the inner nuclear layer (Fig. 6L). Similar also to the chicken (Wöhrn et al., 1998), cdh7 is expressed by the major visual structures in zebrafish brain, the pretectum and the optic tectum (Fig. 6G, H and N).
In both chicken (Ju et al., 2004) and zebrafish (Fig. 5 M and N), cdh7 expression in the hindbrain and spinal cord is confined to the mid-central region with clear boundaries. The dorsal boundary of the cdh7 expression domain in the chicken hindbrain and spinal cord coincides with the boundary between the alar (dorsal) and basal (ventral) plates (Ju et al., 2004). It is possible that the dorsal boundary of the cdh7 expression domain in zebrafish may also define the border between the dorsal and ventral hindbrain/spinal cord. Similar to the chicken hindbrain (Ju et al., 2004), cdh7 expression in zebrafish hindbrain exhibits a neuromeric organization. Unlike the chicken in which cdh7 expression is interrupted at the rhombomere boundaries, cdh7 expression in zebrafish rhombomeres is continuous but with swellings and restrictions, and each swelling straddling the rhombomere boundaries.
Similar to the embryonic chicken, cdh7 expression pattern in the embryonic zebrafish CNS was distinct from other type I and type II cadherins. Compared to Cdh2 (also called N-cadherin), a type I cadherin expressed throughout the CNS of the embryonic zebrafish (Bitzur et al., 1994), cdh7 expression in the embryonic CNS is much more restricted. Cdh4 (also called R-cadherin), another type I cadherin, exhibits a neuromeric expression pattern in both the developing zebrafish brain and spinal cord (Liu et al., 1999, 2001). It also displays a different temporal expression profile from cdh7 (e.g. Cdh4 expression begins after 1 day of development). The cdh7 expression pattern is also different from cdh6 and cdh10, two type II cadherins, in the developing zebrafish nervous system (Liu et al., 2006a, b). cdh6 and cdh10 have more restricted expression in the brain than cdh7, but both cadherins are also expressed by the cranial and lateral line ganglia where cdh7 expression is absent.
2. Experimental procedures
Zebrafish embryos, obtained from in house breeding, were maintained at 28.5oC as described in the Zebrafish Book (Westerfield, 2000). Embryos for whole mount in situ hybridization were raised in PTU (1-phenyl-2-thiourea, 0.003%) and fixed in phosphate buffered 4% paraformaldehyde.
RT-PCR was performed using total RNAs isolated from whole zebrafish embryos. The following zebrafish cdh7 specific primers, designed according to the predicted zebrafish cdh7 sequence in GenBank (accession number: XM 691001), were used for PCR for verification of the predicted cdh7 sequence, analysis of temporal cdh7 expression profile, generation of cDNA template for PCR in vitro synthesis of cdh7 cRNA probes and/or 5′ and 3′RACE: cdh7Fd (5′-TGTTGGCAAGCTTCATTCTG-3′) cdh7Fd1 (5′-AACGATGCCACACAAATTGA-3′), cdh7Fd2 (5′-TGAGGGAAATGGAACAACAA), cdh7Fd3 (5′-CCCAATGCCTATCCTACCAG-3′), cdh7Fd4 (5′-TGGCCAAGATAAAAGCCTTG-3′), cdh7Fd5 (5′-AAATTGAGGCATCCAACAGG-3′), cdh7Fd6 (5′-GGTTGAGGTTAAGGCGACTG-3′), cdh7Fd7 (5′-CAGATGGGAGGACTCTCAGG-3′), cdh7Rv (5′-ACCGTGGGTCTATGTTCCTG-3′), cdh7Rv1 (5′-TCATCGATGGTGAAAATGGA-3′), cdh7Rv2 (5′-CAGAATGAAGCTTGCCAACA-3′), cdh7Rv3 (5′-TCAGGCGAGAACTCTGAGTT-3′), cdh7Rv4 (5′-AAGGGGGTCTGAGATCAGGTA-3′), cdh7Rv5 (5′-AAGGAGGAAAAGGGGGAGAT-3′). To confirm the 5′ end sequence (signal and presequence) of the predicted GenBank zebrafish cdh7 sequence, we performed RT-PCR using primers cdh7Fd1, cdh7Fd2, or cdh7Fd3 to pair with cdh7Rv1 or cdh7Rv2. But the experiments resulted in no amplified product, suggesting that at least part of the predicted signal and presequence for the zebrafish cdh7 gene is incorrect. To obtain the sequence of the missing 5′ end of the zebrafish cdh7, 5′RACE was performed using a 5′RACE kit (Invitrogen, Carlsbad, CA) and zebrafish cdh7 specific primers (cdh7Rv1 and cdh7Rv2). This experiment yielded a nucleotide sequence (Genbank accession No. DQ 411036) that could be aligned with the GenBank sequence (accession No. XM 691001) only from nucleotide 5892 forward. The sequence suggested a likely start codon much closer to the EC1 than previously suggested.
To confirm the 3′ end sequence (end of EC3 to the end of the cytoplasmic domain) of the predicted GenBank zebrafish cdh7 sequence, we performed RT-PCR using primers cdh7Fd4 or cdh7Fd5 to pair with cdh7Rv3, cdh7Rv4 or cdh7Rv5. But there was no amplified product, suggesting that at least part of the predicted 3′ half for the zebrafish cdh7 gene is incorrect. To obtain the sequence of the missing 3′ half of the zebrafish cdh7, 3′RACE was performed using a 3′RACE kit (Invitrogen) and zebrafish cdh7 specific primers (cdhFd5, cdh7Fd6 and cdhFd7). This experiment yielded a nucleotide sequence that could be aligned with the GenBank sequence only through nucleotide 7780 (182 nt from the end).
RT-PCR analysis of cdh7 temporal expression profile was performed using cdh7Fd and cdh7Rv, and zebrafish cdh1 specific primers (cdh1 forward primer: 5′-TGTCAGAGTTGAGCGTGTCC-3′; cdh1 reverse primer: 5′-TTGAAAAACCCACCCTTGTC-3′, GenBank accession number: AF_364811) bracketing a similar cadherin region (EC1 to EC3, 852 bp and 887 bp for cdh7 and cdh1, respectively). cdh1 transcripts were used as the control for the RT-PCR experiments because cdh1 was shown to be strongly expressed by early zebrafish embryos (Babb et al., 2001). The same pair of cdh7 primers (cdh7Fd and cdh7Rv) were used to obtain a cDNA fragment that was cloned into the pCRII-TOPO vector (Invitrogene), verified using restriction mapping and sequencing, and used as a template for the synthesis of digoxigenin-labeled cdh7 cRNA sense or antisense probes for in situ hybridization. For the synthesis of digoxigenin-labeled pax2a or fluorescein-labeled antisense probe, the zebrafish pax2a full-length cDNA in pCRII-TOPO vector (from Dr. Pamela Raymond, university of Michigan) was used as a template. cDNA used to generate the fluorescein-labeled antisense krox20 cRNA probe was kindly provided by Lisa Maves (Fred Hutchinson Cancer Research Center, Seattle, WA). Detailed procedures for the cRNA probe synthesis and whole mount in situ hybridization were described previously (Liu et al., 1999). There was no staining in zebrafish embryos at 18, 24 and 52 hpf using the sense cdh7 probe (data not shown). zn12 antibody (Zebrafish International Resource Center, Eugene, OR) was used at 1:5000. The secondary antibody was biotinylated anti-mouse IgG (Vector laboratories, Burlingame, CA). Detailed procedures for whole-mount immunocytochemistry were reported previously (Liu et al., 2001), while procedures for double labeling experiments were described by Jowett (1999).
Acknowledgments
This work was supported by grants from NIH EY13879 (Q. Liu), NIH DC006436 (J.A. Marrs) and start-up research fund from the University of Akron to Q. Liu. We thank Drs. Pamela Raymond (University of Michigan) and Lisa Maves (Fred Hutchinson Cancer Research Center) for the pax2a and krox20 containing plasmids, respectively.
Footnotes
Grant sponsor: NIH; Grant number: EY13879 (QL), Grant number DC006436 (JAM)
References
- Andermann P, Weinberg ES. Expression of zTlxA, a Hox11-like gene, in early differentiating embryonic neurons and cranial sensory ganglia of the zebrafish embryo. Dev Dyn. 2001;222:595–610. doi: 10.1002/dvdy.1239. [DOI] [PubMed] [Google Scholar]
- Babb SG, Barnett J, Doedens AL, Cobb N, Liu Q, Sorkin BC, Yelick PC, Raymond PA, Gallin WJ, Marrs JA. Zebrafish E-cadherin: expression during early embryogenesis and regulation during midbrain development. Dev Dyn. 2001;221:231–237. doi: 10.1002/dvdy.1132. [DOI] [PubMed] [Google Scholar]
- Becker T, Redies C. Internal structure of the nucleus rotundus revealed by mapping cadherin expression in the embryonic chicken visual system. J Comp Neurol. 2003;467:536–548. doi: 10.1002/cne.10954. [DOI] [PubMed] [Google Scholar]
- Bitzur S, Kam Z, Geiger B. Structure and distribution of N-cadherin in developing zebrafish embryos: morphogenetic effects of ectopic over expression. Dev Dyn. 1994;201:121–136. doi: 10.1002/aja.1002010204. [DOI] [PubMed] [Google Scholar]
- Fushimi D, Arndt K, Takeichi M, Redies C. Cloning and expression analysis of cadherin-10 in the CNS of the chickenen embryo. Dev Dyn. 1997;209:269–285. doi: 10.1002/(SICI)1097-0177(199707)209:3<269::AID-AJA3>3.0.CO;2-G. [DOI] [PubMed] [Google Scholar]
- Gumbiner BM. Cell adhesion: The molecular basis of tissue architecture and morphogenesis. Cell. 1996;84:345–357. doi: 10.1016/s0092-8674(00)81279-9. [DOI] [PubMed] [Google Scholar]
- Hauptmann G, Gerster T. Regulatory gene expression patterns reveal transverse and longitudinal subdivisions of the embryonic zebrafish forebrain. Mech Dev. 2000;91:105–118. doi: 10.1016/s0925-4773(99)00277-4. [DOI] [PubMed] [Google Scholar]
- Heyers D, Kovjanic D, Redies C. Cadherin expression coincides with birth dating patterns in patchy compartments of the developing chicken telencephalon. J Comp Neurol. 2003;460:155–166. doi: 10.1002/cne.10631. [DOI] [PubMed] [Google Scholar]
- Inoue T, Chisaka O, Matsunami H, Takeichi M. Cadherin-6 expression transiently delineates specific rhombomeres, other neural tube subdivisions, and neural crest subpopulations in mouse embryos. Dev Biol. 1997;183:183–194. doi: 10.1006/dbio.1996.8501. [DOI] [PubMed] [Google Scholar]
- Inoue T, Tanaka T, Suzuki SC, Takeichi M. Cadherin-6 in the developing mouse brain: expression along restricted connection systems and synaptic localization suggest a potential role in neuronal circuitry. Dev Dyn. 1998;211:338–351. doi: 10.1002/(SICI)1097-0177(199804)211:4<338::AID-AJA5>3.0.CO;2-I. [DOI] [PubMed] [Google Scholar]
- Inoue T, Tanaka T, Takeichi M, Chisaka O, Nakamura S, Osumi N. Role of cadherins in maintaining the compartment boundary between the cortex and stiatum during development. Development. 2001;128:561–569. doi: 10.1242/dev.128.4.561. [DOI] [PubMed] [Google Scholar]
- Jowett T. Analysis of protein and gene expression. In: Detrich HW, Westerfield M, Zon LI, editors. The Zebrafish Biology. Academic Press; San Diego: 1999. pp. 63–85. [Google Scholar]
- Ju MJ, Aroca P, Luo J, Puelles L, Redies C. Molecular profiling indicates avian branchiomotor nuclei invade the hindbrain alar plate. Neurosci. 2004;128:785–796. doi: 10.1016/j.neuroscience.2004.06.063. [DOI] [PubMed] [Google Scholar]
- Kimmel CB. Patterning the brain of the zebrafish embryo. Annu Rev Neurosci. 1993;16:707–732. doi: 10.1146/annurev.ne.16.030193.003423. [DOI] [PubMed] [Google Scholar]
- Kools P, Imschoot GV, Roy FV. Characterization of three novel human cadherin genes (CDH7, CDH19, and CDH20) clustered on chromosome 18q22– q23 and with high homology to chicken cadherin-7. Genomics. 2000;68:283–295. doi: 10.1006/geno.2000.6305. [DOI] [PubMed] [Google Scholar]
- Krauss S, Johansen T, Korzh V, Fjose A. Expression of the zebrafish paired box gene pax[zf-b] during early neurogenesis. Development. 1991;113:1193–1206. doi: 10.1242/dev.113.4.1193. [DOI] [PubMed] [Google Scholar]
- Lele Z, Folchert A, Concha M, Rauch G-J, Geisler R, Rosa F, Wilson SW, Hammerschmidt M, Bally-Cuif L. parachute/n-cadherin is required formorphogenesis and maintained integrity of the zebrafish neural tube. Development. 2002;129:3281–3294. doi: 10.1242/dev.129.14.3281. [DOI] [PubMed] [Google Scholar]
- Liu Q, Sanborn KL, Cobb N, Raymond PA, Marrs JA. R-cadherin expression in the developing and adult zebrafish visual system. J Comp Neurol. 1999;410:303–319. doi: 10.1002/(sici)1096-9861(19990726)410:2<303::aid-cne11>3.0.co;2-b. [DOI] [PubMed] [Google Scholar]
- Liu Q, Marrs JA, Chuan JC, Raymond PA. Cadherin-4 expression in the zebrafish central nervous system and regulation by ventral midline signaling. Dev Brain Res. 2001;131:17–29. doi: 10.1016/s0165-3806(01)00241-3. [DOI] [PubMed] [Google Scholar]
- Liu Q, Liu B, Wilson AL, Rostedt R. cadherin-6 message expression in the nervous system of developing zebrafish. Dev Dyn. 2006;235:272–278. doi: 10.1002/dvdy.20607. [DOI] [PMC free article] [PubMed] [Google Scholar]
- Liu Q, Duff RJ, Liu B, Wilson AL, Babb-Clendenon SG, Francl J, Marrs JA, Marrs Expression of cadherin10, a type II classic cadherin gene, in the nervous system of the embryonic zebrafish. Gene Expr Patt. 2006 doi: 10.1016/j.modgep.2005.12.009. in press. [DOI] [PMC free article] [PubMed] [Google Scholar]
- Luo J, Treubert-Zimmermann U, Redies C. Cadherins guide migrating purkinje cells to specific parasagittal domains during cerebellar development. Mol Cell Neurosci. 2004;25:138–152. doi: 10.1016/j.mcn.2003.10.003. [DOI] [PubMed] [Google Scholar]
- Macdonald R, Xu Q, Barth KA, Mikkola I, Holder N, Fjose A, Krauss S, Wilson SW. Regulatory gene expression boundaries demarcate sites of neuronal differentiation in the embryonic zebrafish forebrain. Neuron. 1994;13:1039–1053. doi: 10.1016/0896-6273(94)90044-2. [DOI] [PubMed] [Google Scholar]
- Malicki J, Jo H, Pujic Z. Zebrafish N-cadherin, encoded by the glass onion locus, plays an essential role in retinal patterning, Dev. Biol. 2003;259:95–108. doi: 10.1016/s0012-1606(03)00181-7. [DOI] [PubMed] [Google Scholar]
- Masai I, Lele Z, Yamaguchi M, Komori A, Nakata A, Nishiwaki Y, Wada H, Tanaka H, Nojima Y, Hammerschmidt M, Wilson SW, Okamoto H. N-cadherin mediates retinal lamination, maintenance of forebrain compartments and patterning of retinal neuritis. Development. 2003;130:2479–2494. doi: 10.1242/dev.00465. [DOI] [PubMed] [Google Scholar]
- Mastick GS, Davis NM, Andrw GL, Easter SS., Jr Pax-6 functions in boundary formation and axon guidance in the embryonic mouse forebrain. Development. 1997;124:1985–1997. doi: 10.1242/dev.124.10.1985. [DOI] [PubMed] [Google Scholar]
- Nollet F, Kools P, van Roy F. Phylogenetic analysis of the cadherin superfamily allows identification of six major subfamilies besides several solitary members. J Mol Biol. 2000;299:551–572. doi: 10.1006/jmbi.2000.3777. [DOI] [PubMed] [Google Scholar]
- Oxtoby L, Jowett T. Clonging of the zebrafish krox-20 (krx-20) and its expression during hindbrain development. Nucleic Acids Res. 1993;21:1087–1095. doi: 10.1093/nar/21.5.1087. [DOI] [PMC free article] [PubMed] [Google Scholar]
- Puelles L, Rubenstein JLR. Expression patterns of homeobox and other putative regulartory genes in the embryonic mouse forebrain suggest aneuromeric organization. Trends Neurosci. 1993;16:472–479. doi: 10.1016/0166-2236(93)90080-6. [DOI] [PubMed] [Google Scholar]
- Radice GL, Rayburn H, Matsunami H, Knudsen KA, Takeichi M, Hynes RO. Developmental defects in mouse embryos lacking N-cadherin. Dev Biol. 1997;181:64–78. doi: 10.1006/dbio.1996.8443. [DOI] [PubMed] [Google Scholar]
- Redies C. Cadherins and the formation of neural circuitry in the vertebrate CNS. Cell Tiss Res. 1997;290:405–413. doi: 10.1007/s004410050947. [DOI] [PubMed] [Google Scholar]
- Redies C. Cadherins in the central nervous system. Prog Neurobiol. 2000;61:611– 648. doi: 10.1016/s0301-0082(99)00070-2. [DOI] [PubMed] [Google Scholar]
- Ross LS, Parrett T, Easter SS., Jr Axonogenesis and morphogenesis in the embryonic zebrafish brain. J Neurosci. 1992;12:467–482. doi: 10.1523/JNEUROSCI.12-02-00467.1992. [DOI] [PMC free article] [PubMed] [Google Scholar]
- Takeichi M. Cadherin cell adhesion receptors as a morphogenetic regulator. Science. 1991;251:451–455. doi: 10.1126/science.2006419. [DOI] [PubMed] [Google Scholar]
- Treubert-Zimmermann U, Heyers D, Redies C. Targeting axons to specific fiber tracts in vivo by altering cadherin expression. J Neurosci. 2002;22:7617–7626. doi: 10.1523/JNEUROSCI.22-17-07617.2002. [DOI] [PMC free article] [PubMed] [Google Scholar]
- Trevarrow B, Marks DL, Kimmel B. Organization of hindbrain segments in the zebrafish embryo. Neuron. 1990;4:669–679. doi: 10.1016/0896-6273(90)90194-k. [DOI] [PubMed] [Google Scholar]
- Westerfield M. The zebrafish Book. Eugene, OR: University of Oregon Press; 2000. [Google Scholar]
- Wöhrn JCP, Puelles L, Nakagawa S, Takeichi M, Redies C. Cadherin expression in the retina and retinofugal pathways of the chicken embryos. J Comp Neurol. 1998;396:20–38. [PubMed] [Google Scholar]


