
Figure 1.
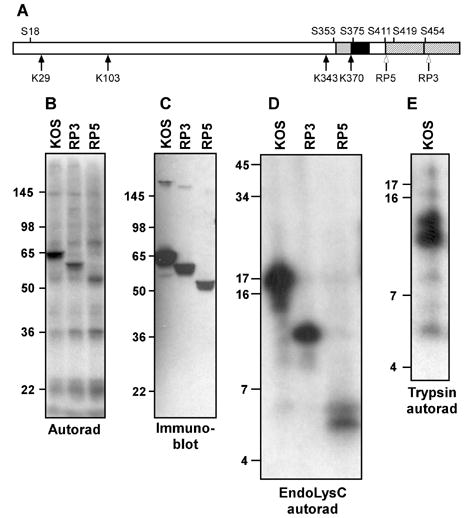
Mapping VP16 phosphorylation sites using deletion mutants and peptide mapping. A. Schematic diagram of VP16. The two subregions of the C-terminal activation domain are denoted by hatching. Regions implicated in interaction with Oct-1 and HCF-1 are indicated by black and grey boxes, respectively. The four lysine residues in VP16 (K) and some of the serine residues (S) are indicated. Open arrows mark the truncations of the VP16 open reading frame in the viral strains RP3 and RP5. B. Autoradiogram of material precipitated using a VP16-specific monoclonal antibody (LP1) from HeLa cells infected by virus strains KOS, RP3 and RP5 and radiolabeled with [32P]-orthophosphate from 1.5 to 8 hour post-infection. The relative positions of protein molecular weight standards following separation on a 10% SDS-PAGE gel are indicated (in kDa). C. Immunoblot of a gel in parallel to that shown in panel B, probed with a VP16-specific polyclonal antibody (C8). D. Autoradiogram of radiolabeled VP16 fragments following digestion by lysyl endopeptidase (LysC), separated on a 16% polyacrylamide gel. E. Autoradiogram of radiolabeled VP16 fragments following digestion by trypsin and separation on a 16% polyacrylamide gel.