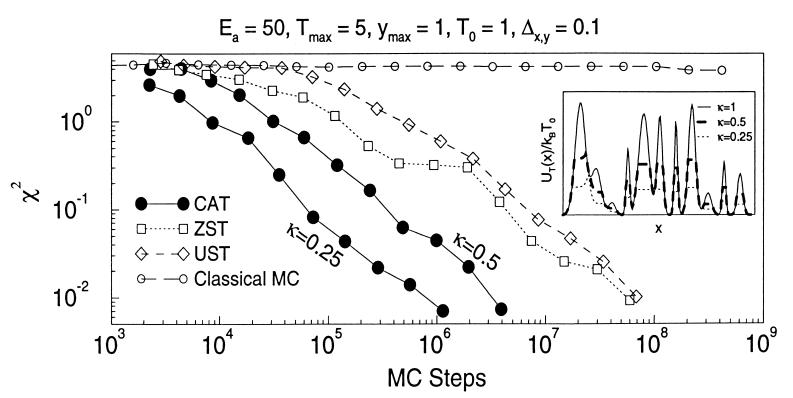
Figure 1.
The decay of the square deviation given by Eq. 11 as a function of the number of Monte Carlo (MC) steps for the one-dimensional random potential of Eq. 10 and different Monte Carlo schemes (CAT, ZST, UST and classical Monte Carlo). The random potential is plotted in the inset for various values of κ which controls the level of truncation of the barriers. The other parameters of the Monte Carlo run are detailed above the figure. For the most severe truncation, CAT samples this potential 100 times faster than the simulated tempering methods.

