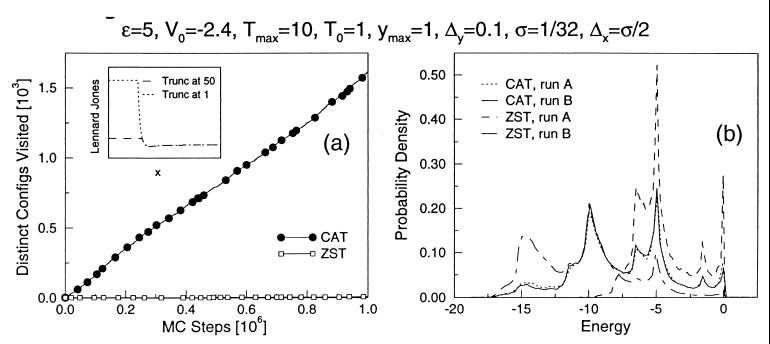
Figure 2.
(a) Time course of the number of distinct rod-orderings in the linear array of Lennard–Jones rods for CAT (solid circles) and ZST (open squares). We used a truncated Lennard–Jones potential at 50ɛ, and for CAT further truncated in the c.r. at ɛ (see Inset). ZST visited only four different orderings after 106 iterations. For CAT the different orderings grows linearly with time. (b) Probability density functions of the energy surface for the linear array of Lennard–Jones rods in two independent runs of CAT (solid line and dotted line) and two independent runs of ZST (dashed line and dot dashed lines), after 106 Monte Carlo passes. The two distributions from the CAT runs are almost identical. The two distributions from the ZST are quite different. Energy in units of T0.

