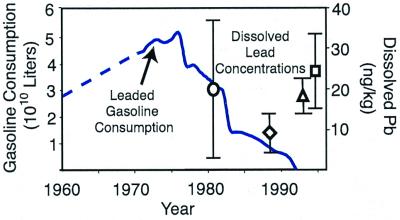
Figure 2.
Historic leaded gasoline consumption and lead concentrations in northern reach waters. The blue line charts leaded gasoline consumption in liters for the state of California from 1960 to 1992 (personal communication, J. Cogan, Energy Information Administration). Consumption is estimated for the years 1960–1970 based on the available data from 1960 and 1970. Concentrations of dissolved lead for the northern reach are given for 1979 (23), 1989, 1993, and 1995. Concentrations for each year are the average of three stations in the northern reach during the summer when the waters at each station had comparable salinities. Error bars are one standard deviation of the three station averages.

