Figure 2.
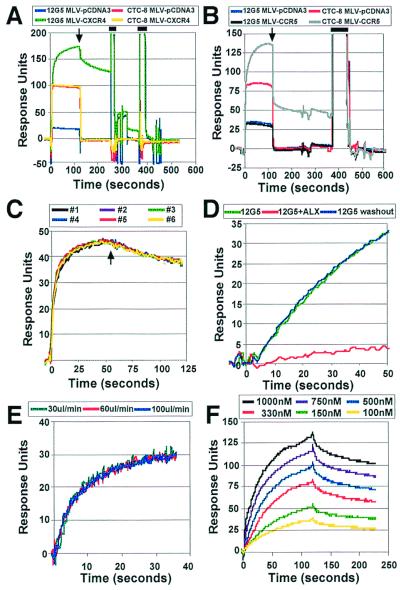
Antibody binding to chemokine receptor pseudotypes. (A) Equivalent amounts of MLV–CXCR4 and MLV–pCDNA3 were attached to a Biacore F1 chip. Binding of 333 nM 12G5 and 666 nM CTC8 to MLV–CXCR4 and MLV–pCDNA3 is shown. Binding was measured for 120 s before washing with PBS running buffer for an additional 120 s to measure dissociation (indicated by arrow). Regeneration pulses are indicated by bars. Instrument noise between the regeneration pulses is due to changes in flow rate and the injections of the regeneration buffer, which lead to immediate shifts in the signal baseline. The slower changes in signal reflect binding of proteins to the sensor surface. (B) Equivalent amounts of MLV–CCR5 and MLV–pCDNA3 were attached to a Biacore F1 chip, and the binding of 400 nM CTC8 or 800 nM 12G5 to MLV–CCR5 and MLV–pCDNA3 is shown. A single regeneration pulse (bar) was used to strip bound antibody. (C) The data from six sequential injections of 166 nM 12G5 to MLV–pCDNA3 and MLV–CXCR4 are overlayed. In all cases, and in all subsequent figures, the sensorgrams show subtracted data, in which the signal obtained from the control surface is subtracted from the signal obtained from the surface bearing receptor-positive particles. Binding was measured for 60 s. Regeneration conditions were similar to those used in A. (D) Subtracted data from the binding of 5 nM 12G5 to MLV–CXCR4 and MLV–pCDNA3 is shown in green. After regeneration, binding in the presence of the CXCR4 inhibitor ALX40–4C (at 4 μM) is shown in red, whereas binding of the antibody following washout of the inhibitor is shown in blue. (E) Subtracted data for serial injections of 111 nM 12G5 to MLV–CXCR4 and MLV–pCDNA3 at different flow rates are shown. Regeneration conditions were similar to those used in A. (F) Subtracted data from binding of serial dilutions of CTC8 to MLV–CCR5 and MLV–pCDNA3 are shown.

