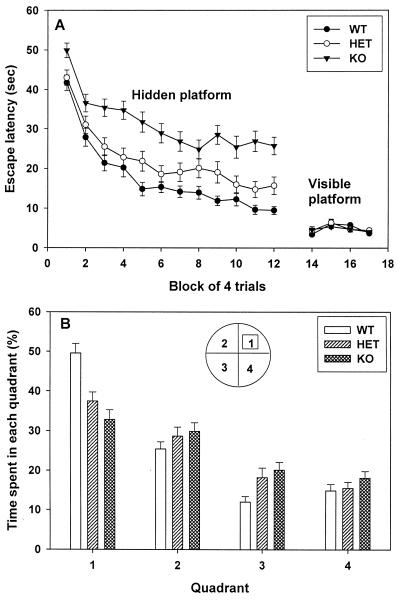
Figure 3.
Learning performance in the Morris water maze. (A) In the first part of the experiment, WT (+/+, n = 40), HET (+/−, n = 43), and KO (−/−, n = 39) mice received 12 blocks of training (3 blocks of 4 trials per day for 4 consecutive days) in the hidden platform version of the maze. The graph shows the escape latency to find the hidden platform for each genotype over successive blocks of trial. Thereafter, each animal was given 4 blocks of the visible platform test (n = 18, 18, and 20 for WT, HET, and KO, respectively). (B) During the probe trial after the twelfth block of training, WT mice spent significantly more time at the trained quadrant no. 1 (49.5 ± 2.4%, n = 40) than did KO mice (32.8 ± 2.4%, n = 39), and HET mice displayed an intermediate performance (37.4 ± 2.2%, n = 43) (one-way ANOVA, P < 0.001). Means ± SEM are given.

