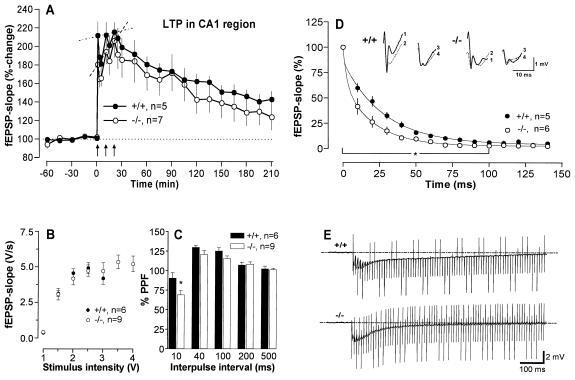
Figure 4.
LTP, basal synaptic transmission, and short-term plasticity in the hippocampal CA1 region of WT and KO mice. (A) LTP was induced by a repeated strong tetanization protocol consisting of 3 stimulus trains at 100 Hz (0.2 msec per polarity) with a 10-min intertrain interval. During the initial phase of potentiation, WT mice attained nearly the maximal level of potentiation after the first tetanus, whereas KO mice progressively increased the potentiation after each tetanus. For KO (but not WT) mice, the magnitude of the third tetanus potentiation was significantly greater than that of the first (P = 0.018 Wilcoxon matched-pairs signed rank test). Arrows indicate the time of tetanization. (B) Input/output curves of the KO and WT mice. fEPSP slopes were recorded at increasing stimulation intensities until a maximum was attained. There were no significant differences between the two groups. (C) Short-term plasticity as evaluated by paired-pulse stimulation at different IPIs. Although paired-pulse stimulation at an IPI of 10 ms resulted in PPD, at all other IPIs, PPF appeared. Note the stronger PPD of KO mice (P < 0.05). (D) Decay of fEPSPs during the first tetanic stimulation. The slope of 15 consecutive fEPSPs immediately at the onset of tetanic stimulation was determined, averaged across each group, and plotted vs. time. The curves were obtained by nonlinear fits with a two-phase exponential equation. The fEPSPs of KO mice decayed much faster than the WT in the initial part (first 100 ms) of the decay (P = 0.022, ANOVA with repeated measures). Insets show analogue traces of the first four fEPSPs during the first tetanization. Note the marked decay of fEPSP slope of the KO mouse between the first and second recording. (E) Representative analogue recordings of fEPSP changes in a WT vs. KO during the first tetanization. The faster decay of fEPSPs in the KO results in a smaller depolarizing envelope evoked by summation of the fEPSPs (area: WT, 878.4 units; KO, 530.5 units). The applied sampling rate permits a clear distinction of the fEPSPs between the WT and KO.

