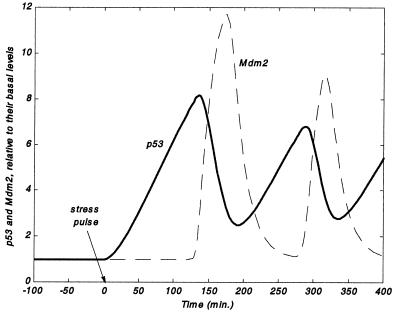
Figure 2.
Numerical solution of Eqs. 1-6. p53 and Mdm2 levels (relative to their basal amounts) undergo oscillations after an initial pulse of stress at t = 0. Mdm2 protein levels peak with a delay of ≈1 h after the peak in p53 levels. Mdm2 minima coincide with p53 maxima. Here, sourcep53 = 0.5; dp53 = 2.5E-04; p1 = 2.35E-03; p2max = 0.03; n = 50; Km = 25; dMdm2 = 0.05; c1 = 1.52E-02; c2 = 0.01; kdelay = 1.52E-02; repair = 1.E-04; degradationbasal = 2; kdeg = 1.93; kdamp = 0.05; p53(t = 0) = 5.3; Mdm2(t = 0) = 0.047; signal(t = 0) = 1.

