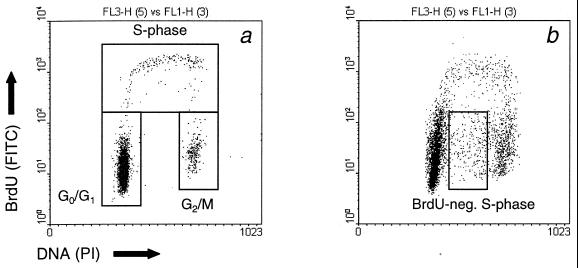
Figure 1.
Bivariate dot plots showing the distribution of the green fluorescence of the FITC anti-BrdUrd staining (DNA synthesis; y axis) versus the red fluorescence of the propidium iodide staining (DNA content; x axis) of keratinocytes from Xpc−/− mice. Mice were mock treated (a) or exposed to a single dose of UVB (b; 500 J/m2) 72 h before cell isolation. Cells were labeled in vivo with BrdUrd during the last hour before epidermal cell isolation.

