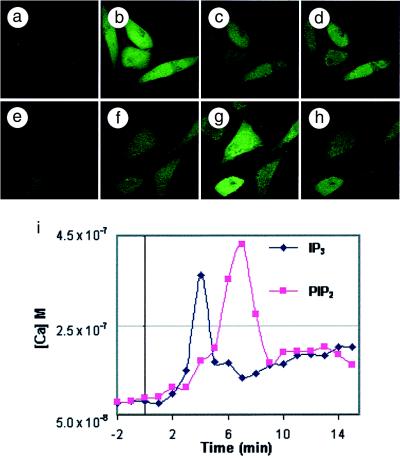
Figure 4.
Carrier-delivered Ins(1,4,5)P3 and PtdIns(4,5)P2 caused calcium flux in NIH 3T3 cells. Fibroblasts were loaded with Fluo-3; after 15 min, a time course of images was collected. After an additional 2 min, either an Ins(1,4,5)P3-histone or a PtdIns(4,5)P2-histone complex was added to the cells, and increased intracellular calcium was detected by increased green fluorescence. (a–d) t = 0, 4, 7, and 15 min after addition of the Ins(1,4,5)P3-histone complex; calcium concentrations were 81 nM, 362 nM, 133 nM, and 164 nM, respectively. (e–h) t = 0, 4, 7, and 15 min after addition of the PtdIns(4,5)P2-histone complex; calcium concentrations were 88 nM, 171 nM, 430 nM, and 191 nM, respectively. (i) A time course of subcellular pixel intensities, in min, after addition of the Ins(1,4,5)P3-histone and PtdIns(4,5)P2-histone complexes. The same optical section was collected for each time point by using the 488-nm excitation line (laser power 0.3%). Magnifications: a–h, ×240.

