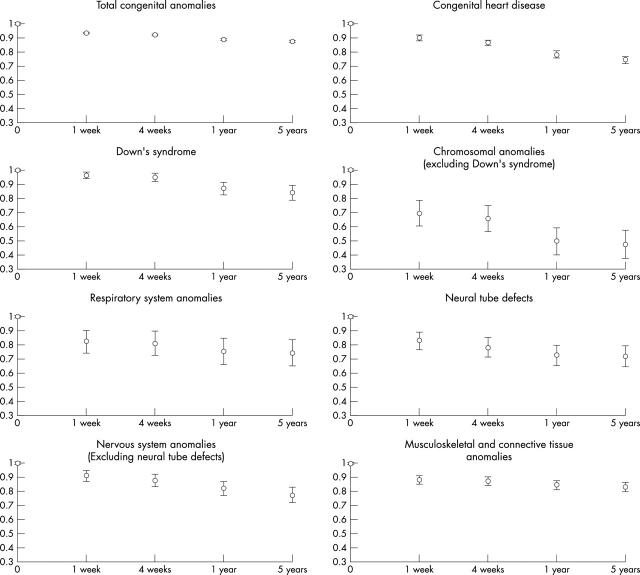
Figure 1.
Survival of children with selected congenital anomalies (with 95% CI). x and y axes refer to "age at death" and "cumulative proportion surviving", respectively. Note that in some graphs, the large number of cases for total congenital anomalies results in extremely small confidence intervals, which are not properly visible.

