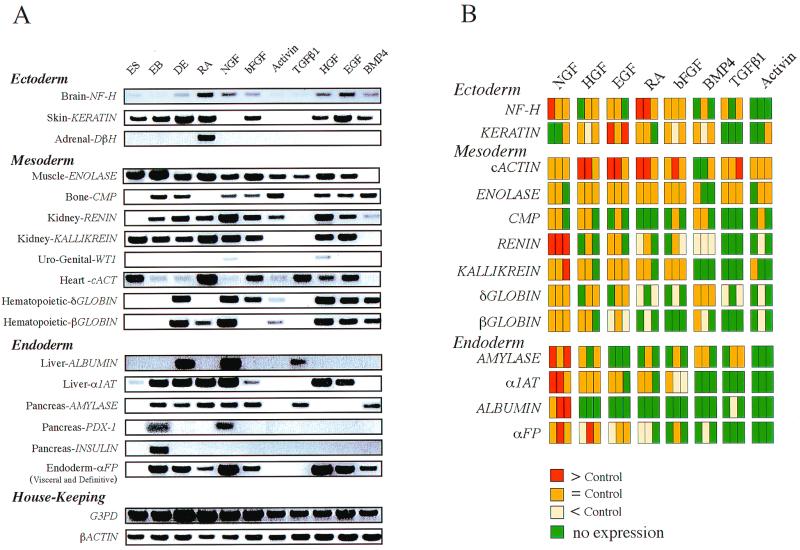
Figure 3.
(A) Analysis of expression of cell-specific genes in human ES cells treated with various growth factors. RNA from ES, 20-day-old EBs, and DE cells treated with the different growth factors was analyzed by RT-PCR for expression of seventeen cell-specific genes and two housekeeping genes. The genes were categorized by their embryonic germ layer (24). [Note that cartilage may derive from the ectodermal neural crest as well as from the mesoderm (24)]. For abbreviations of the various gene primers used, see Materials and Methods. (B) Schematic representation of the growth factor effects on gene expression. Results are shown from three experiments on the effects of NGF, HGF, EGF, RA, bFGF, BMP4, TGF-β1, or activin-A on the expression of 13 genes. The results are color-coded: orange represents similar expression to the control (no growth factor), red represents induction of at least 2-fold, yellow represents inhibition of 2-fold or more, and green represent no detectable expression.

