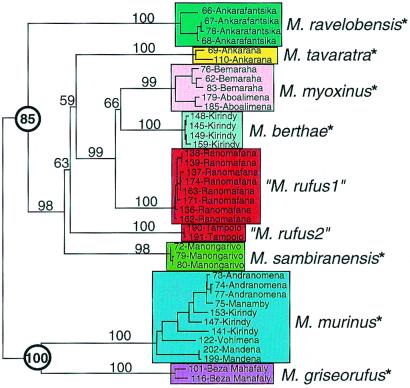
Figure 2.
Phylogeny derived from sequence alignment of 2,404 bp of combined mtDNA sequences from the control region homologous with the hypervariable region 1 region in humans, COII and cytochrome b. Clades are color-coded to emphasize species diversity. Individuals are identified by unique laboratory extraction number (Yoder Lab Extraction; YLE) and by locality. Distance tree was generated in paup* 4.0b4a (PPC) (53) by using HKY85 correction model (54) and weighted least squares (power = 2) algorithm. A total of 1,000 replicates of the random addition option were executed without branch swapping. TBR branch swapping then was performed on best tree (hit 399 of 1,000 trials). A single tree of score 0.83 (%SD = 3.27) resulted from the search and is shown with midpoint rooting. Location of midpoint root was confirmed by multiple outgroup rootings. Clade resolution and hierarchy is congruent with strict consensus of 12 trees derived from maximum parsimony analysis in which 100,000 random additions were performed without branch swapping, followed by TBR branch swapping of the 10 best trees. Numbers on branches indicate statistical support from 100 bootstrap replicates with one random addition per replicate. Propithecus, Varecia, and Eulemur were used to root the bootstrap tree. Circled numbers highlight bootstrap support for two primary clades. Asterisks beside species designations indicate species that have been reported to occur in sympatry with another mouse lemur type. See ref. 11 for details.

