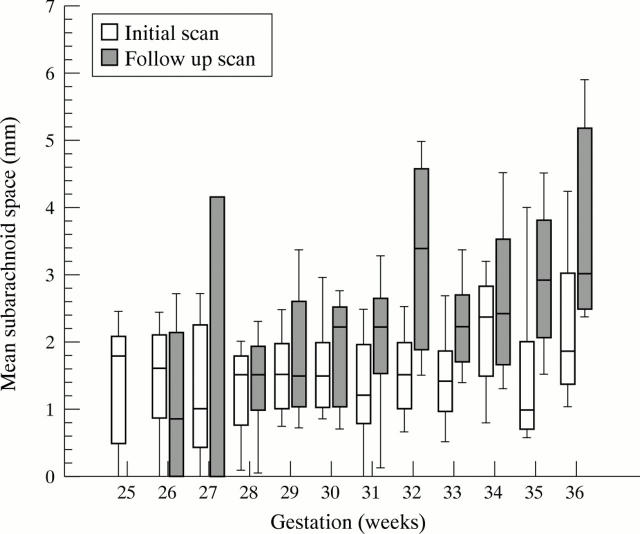
Figure 2 .
Box plot of subarachnoid space measurements at each gestational week of age. Bars show interquartile range, the middle line indicates the median, and whiskers indicate the 10th and 90th centiles. For initial scans, n = 201 (range 6–29 for each week), for follow up scans, n = 160 (range 3–22 for each week).

