
Figure 1 .
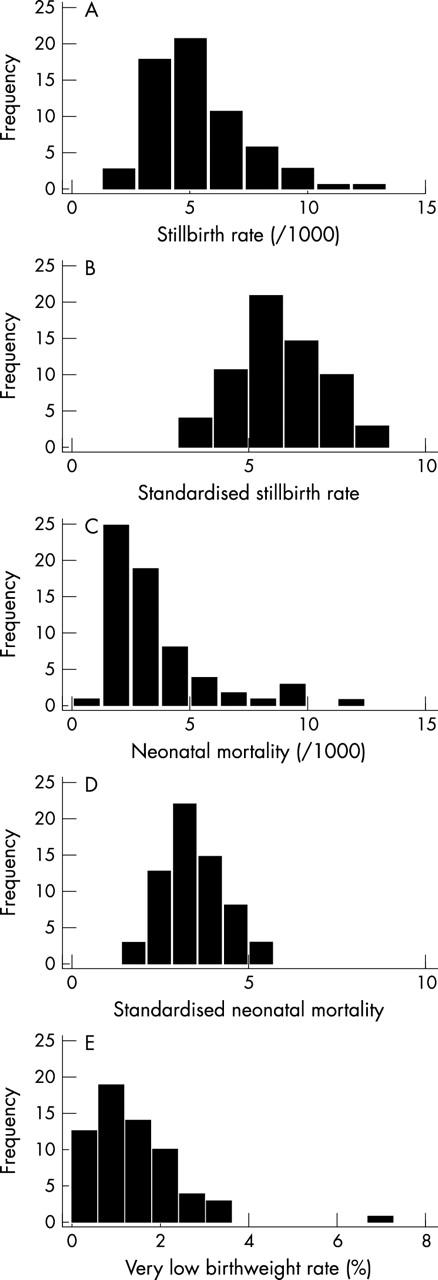
Histograms of the crude (A) and standardised (B) stillbirth rates and crude (C) and standardised (D) neonatal mortality and the very low birthweight (< 1500 g) rates (E), Thames hospitals, 1994–1996 (n = 64).
Official websites use .gov
A
.gov website belongs to an official
government organization in the United States.
Secure .gov websites use HTTPS
A lock (
) or https:// means you've safely
connected to the .gov website. Share sensitive
information only on official, secure websites.
Histograms of the crude (A) and standardised (B) stillbirth rates and crude (C) and standardised (D) neonatal mortality and the very low birthweight (< 1500 g) rates (E), Thames hospitals, 1994–1996 (n = 64).