
Figure 2 .
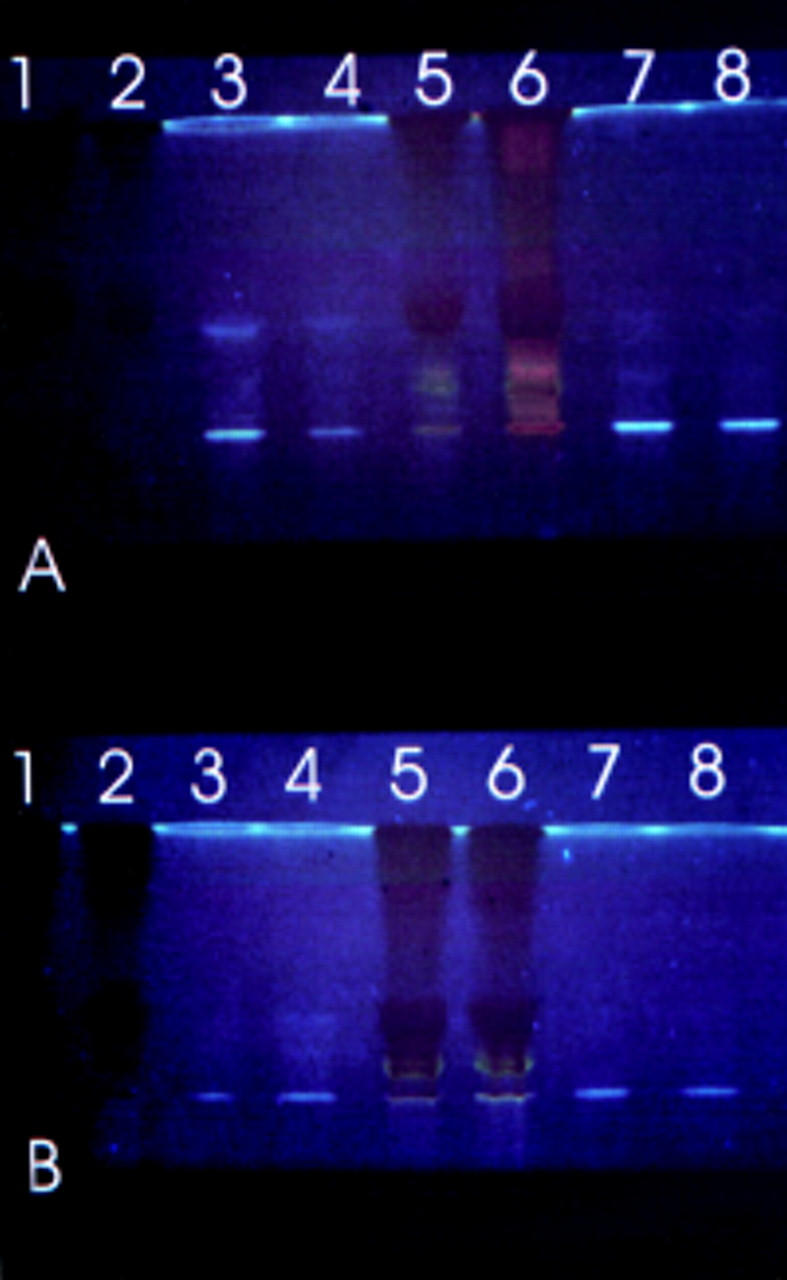
TLC profile of chloroform soluble fluorophores generated by incubating retinal with ROS. Lanes 1 to 4 contain freshly prepared material; lanes 5 to 8 material after 7 days' incubation. Plate (A) contains samples at pH 7, plate (B) samples at pH 4.5. Lanes 1 and 5, retinal + ROS + BSA; lanes 2 and 6, retinal + ROS; lanes 3, 4, 7, and 8, ROS alone. The plates shown are representative of a typical experiment.