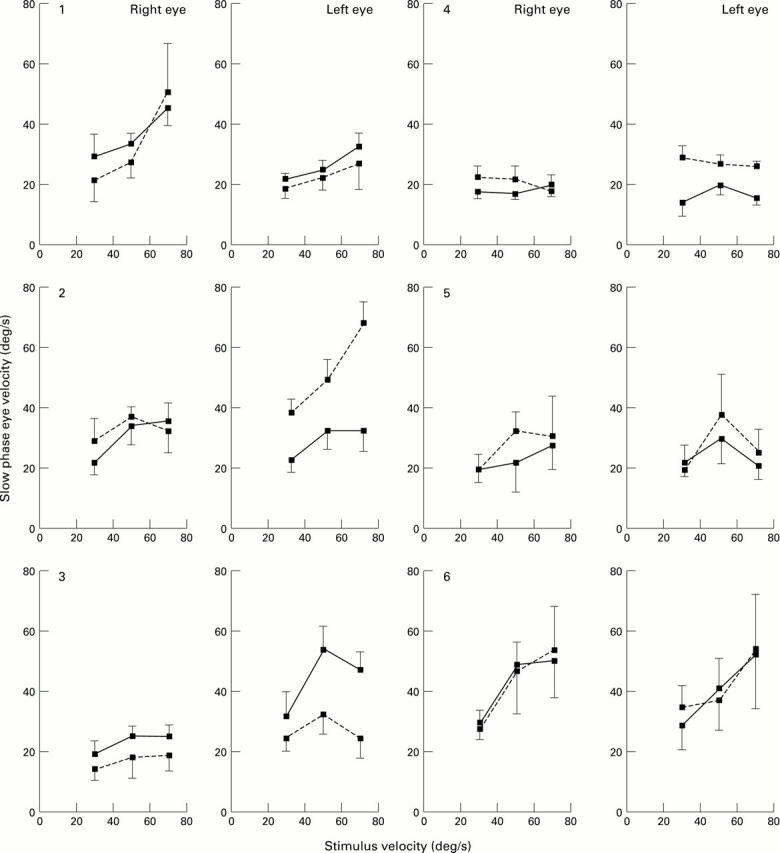
Figure 1 .

The relation between slow phase velocity and stimulus velocity for the right and left eye of each of six age-matched control patients for unidirectional optokinetic stimulation. Three stimulus velocities are illustrated: 30, 50, and 70°/s. The direction of the stimulus was either nasal-temporal (solid line) or temporal-nasal (broken line). The vertical bars indicate the standard deviation of the mean of 10 slow phases.
