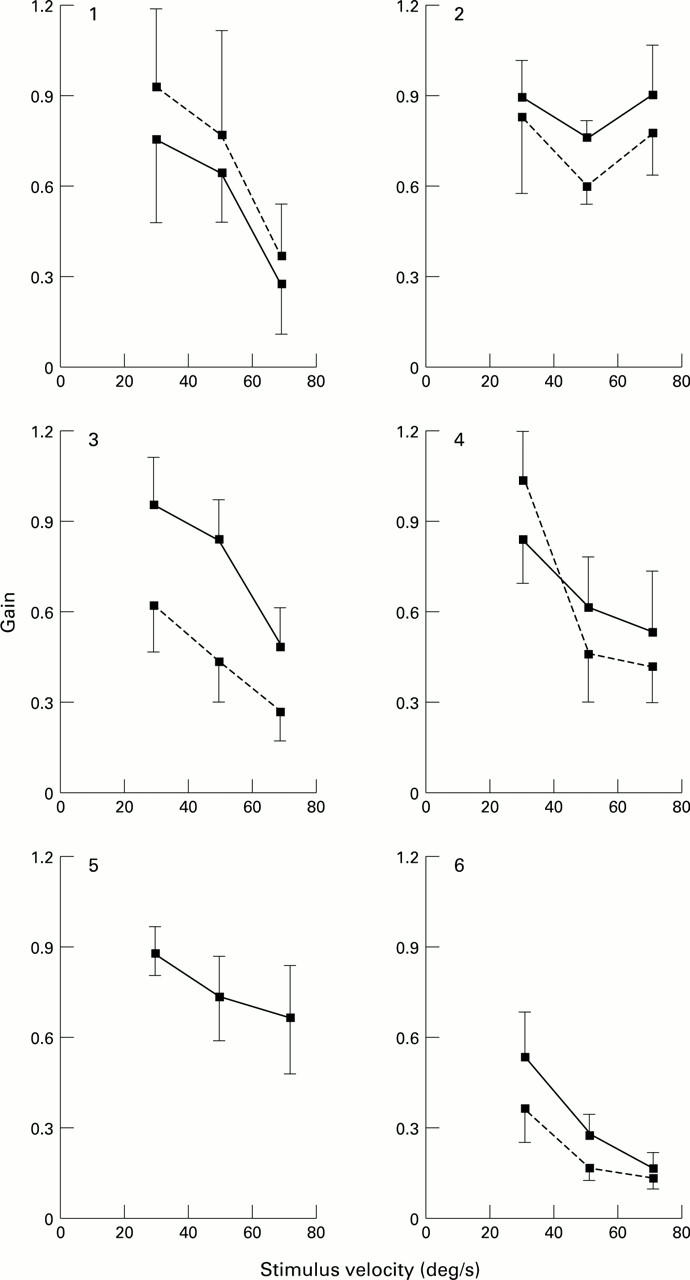
Figure 4 .

The relation between optokinetic gain and stimulus velocity for each of the six patients with ARM. The direction of the stimulus was either nasal-temporal or temporal-nasal and the data of the optokinetic responses, elicited under both conditions, have been averaged for each patient's right (solid line) and left eye (broken line). Vertical bars represent the standard deviation of the mean of 20 slow phases (10 measurements for each of the two directions) The left eye of patient No 5 was not examined.
