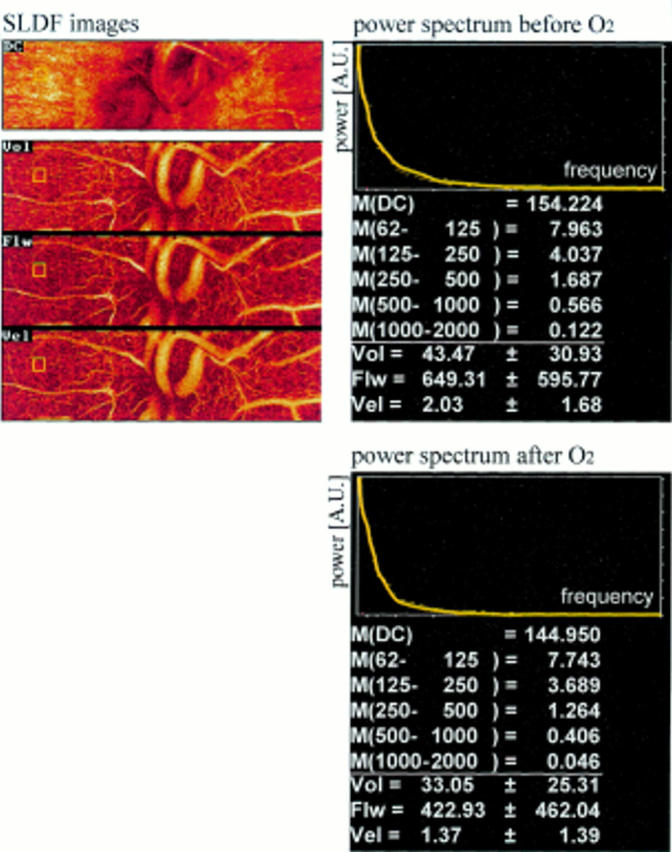
Figure 2 .

Scanning laser Doppler flowmetry images with power spectra before and after breathing oxygen. Above (from top to bottom): ophthalmoscopic image images volume (Vol), flow (Flw), velocity (Vel). Right, top: power spectra. Bottom: M(DC) = mean power of DC value (the DC value is proportional to the power of the reflected non-frequency shifted light). M(62-125) = mean power in the frequency ranges 62 Hz to 125 Hz lines below mean power in respective frequency ranges.
