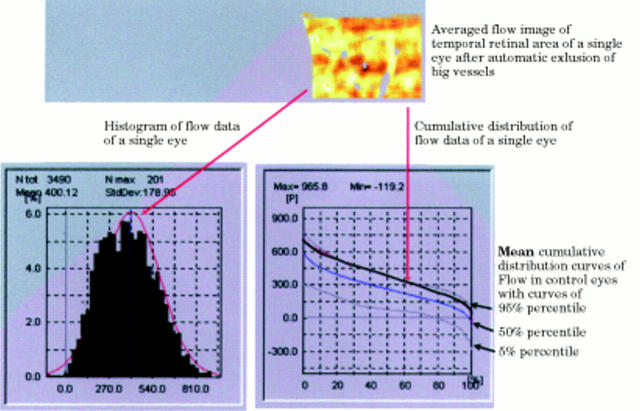
Figure 2 .
Automatic statistical analysis and presentation of blood flow of the temporal area, with the histogram of all flow values, and the cumulative frequency distribution curve of flow of a single eye in comparison with the mean cumulative frequency distribution curve of the control group with the 5% percentile curve and the 95% percentile curve. Note that the cumulative frequency distribution curve of the examined eye lies in the high 90s. The 5% percentile curve and the 95% percentile curve define the normal range of flow.

