
Figure 5 .
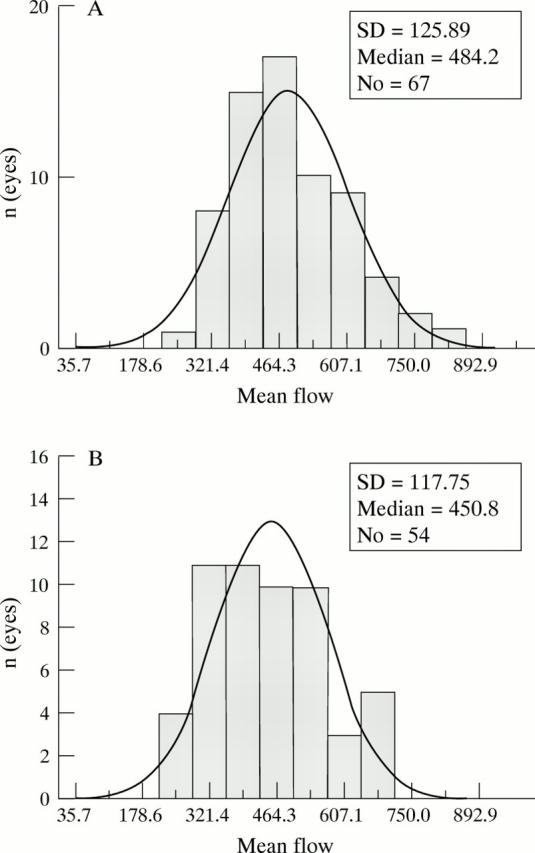
(A) Histogram of mean flow values of the nasal area of 54 normal subjects. (B) Histogram of mean flow values of the temporal area of 67 normal subjects.
Official websites use .gov
A
.gov website belongs to an official
government organization in the United States.
Secure .gov websites use HTTPS
A lock (
) or https:// means you've safely
connected to the .gov website. Share sensitive
information only on official, secure websites.
(A) Histogram of mean flow values of the nasal area of 54 normal subjects. (B) Histogram of mean flow values of the temporal area of 67 normal subjects.