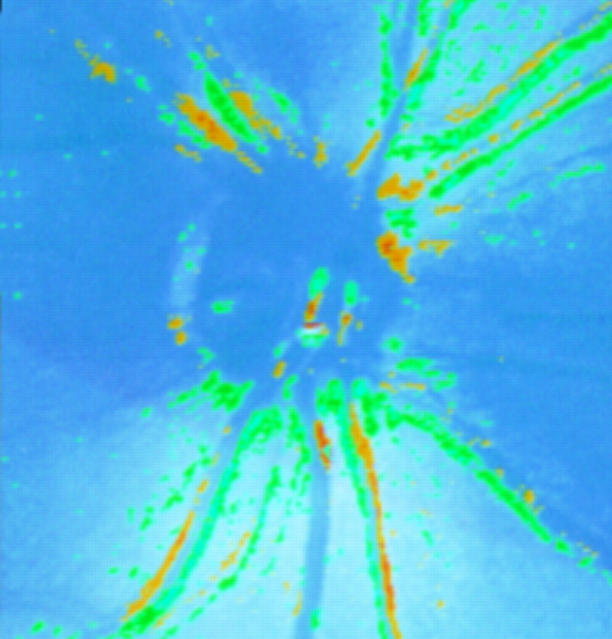
Figure 3 .
An illustration of a comparison map of compiled by the NFA I software of two retardation images of the same eye of a normal subject taken within 2 minutes of each other by the same operator (AW). The yellow and green regions reflect areas of statistically significant change in the retardation values obtained from these locations.

