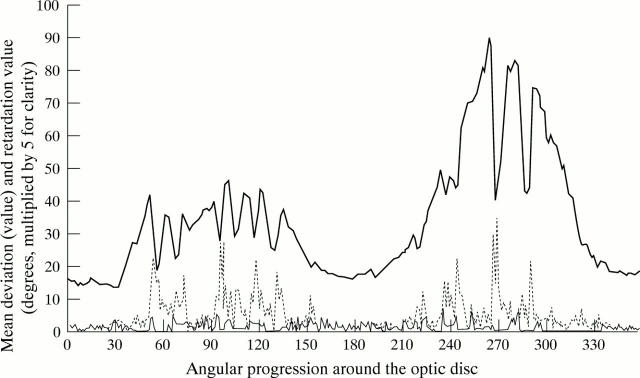
Figure 5 .
A polar profile of a normal subject with an illustration of the areas of greatest measurement variability in the shape of this profile. The polar profile (retardation values multiplied by five for clarity) is illustrated by the solid bold line. The variability of the profile shape at individual locations is illustrated by the broken line (before the application of the blood vessel removal algorithm) and by the fine line (after the application of the algorithm).

