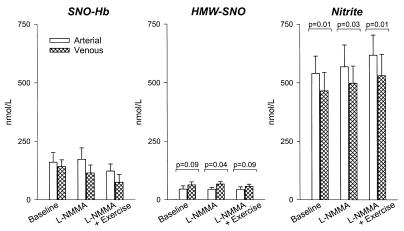
Figure 2.
Plasma circulatory levels of nitrite, HMW-SNO, and SNO-Hb at rest and during NO synthase inhibition followed by exercise. SNO-Hb: S-nitrosohemoglobin in arterial (empty bars) and venous (hatched bars) red blood cells at rest and during L-NMMA infusion, followed by exercise. The arterial and venous levels were close to the limits of detection by chemiluminescent technology at 1.6 × 10⁻⁵ mol NO/mol heme subunit (161 nM in whole blood) and 1.4 × 10⁻⁵ mol of NO/mol of heme subunit (141 nM in whole blood), respectively. We observed an insignificant arterial-venous gradient in SNO-Hb (P = 0.53 at baseline, P = 0.17 during L-NMMA infusion, and P = 0.31 during exercise, by paired t test, and P = 0.24 by repeated-measures ANOVA). HMW-SNO: plasma passed through a G25 Sephadex sizing column was reacted in I3− to measure HMW-SNO in arterial and venous plasma. HMW-SNO displayed a reversed gradient with venous levels (63.4 ± 13 nM) greater than arterial levels (44.9 ± 14 nM) (P values for paired t tests shown and P < 0.05 for venous-arterial differences by repeated-measures ANOVA). Nitrite: filtered plasma was reacted in KI in acetic acid to measure nitrite in arterial and venous plasma. Although nitrite levels varied widely between individuals, within individuals the arterial levels of nitrite (540 ± 74 nM) were significantly higher than venous levels (466 ± 79 nM), suggesting delivery or metabolism in the peripheral circulation (P < 0.05 for all experiments by paired t test).

