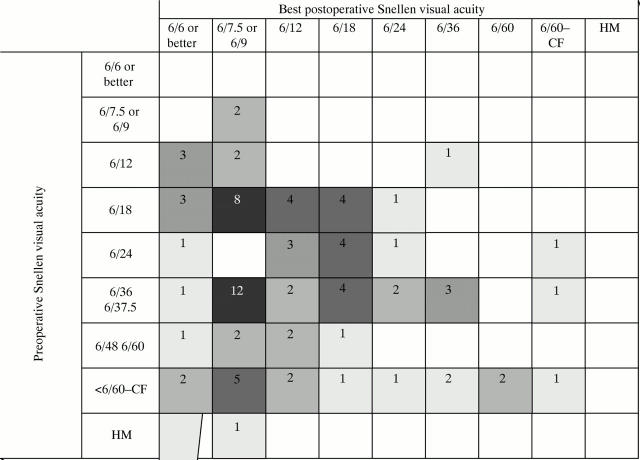
Figure 1 .
Frequency table showing improvement in distance visual acuity. Shading in cells approximately proportional to cell frequency. The down sloping diagonal represents no change in visual acuity, cells below and to the left represent an improvement in visual acuity. CF= counting fingers; HM= hand movements. Missing data have been omitted (n=91). Where Snellen equivalent falls between common chart test sizes the nearest poorer acuity has been used.

