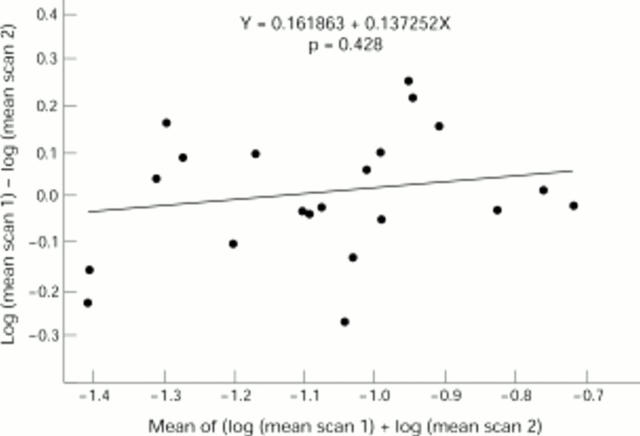
Figure 5 .
Agreement between scan 1 and scan 2 is examined by plotting the difference between the log values of the mean of three examinations against the mean of the log values. The slope of the regression line is not significant (p = 0.428) and the mean difference of the log transformed data (0.016) is almost zero.

