
Figure 3 .
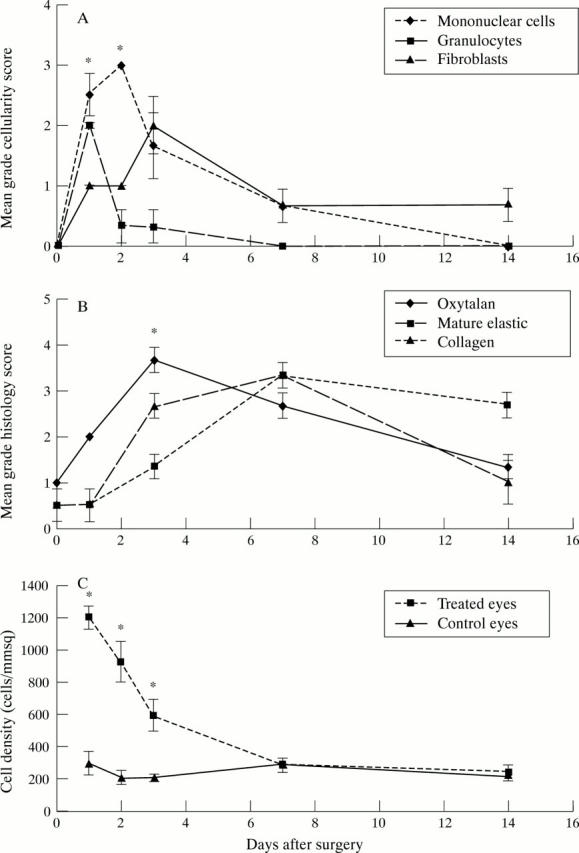
(A) Graph showing the cellular profile of mononuclear cells, granulocytes, and fibroblast activity in the bleb area over time, as graded by a masked observer (IAC). The consecutive peaks of these cell types demonstrate the classic wound healing response. (B) Graph showing the histochemical staining characteristics and the conjunctival scarring response. Newly laid extracellular matrix is demonstrated by the early deposition of oxytalan fibres, which later undergo maturation into elastic fibres. Collagen deposition occurs in association with wound remodelling, organisation, and contraction. (C) Graph showing the cellular density in injected eyes compared with their contralateral control eyes. A fourfold increase in cellular density is seen at day 1. (All graphs show SEM error bars, with * indicating statistical significant differences between groups p<0.05.)