
Figure 6 .
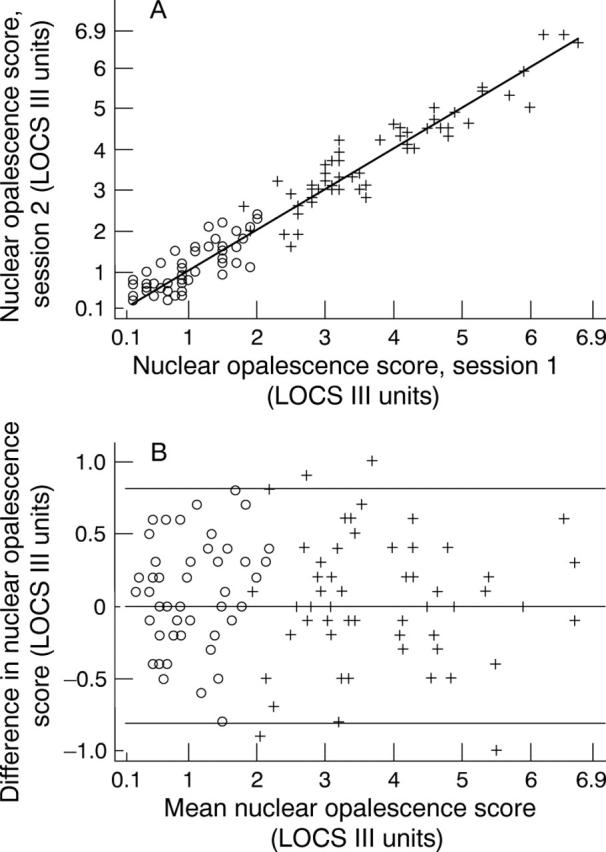
(A) Relation between LOCS III nuclear opalescence scores measured at the first and second visits for 55 eyes of healthy subjects (∘) and 58 eyes of subjects from the cataract waiting list (+). (B) Bland-Altman plot for LOCS III nuclear opalescence. Difference between LOCS III nuclear opalescence scores for the two visits plotted against the mean for 55 eyes of healthy subjects (∘) and 58 eyes of subjects from the cataract waiting list (+).