
Figure 1 .
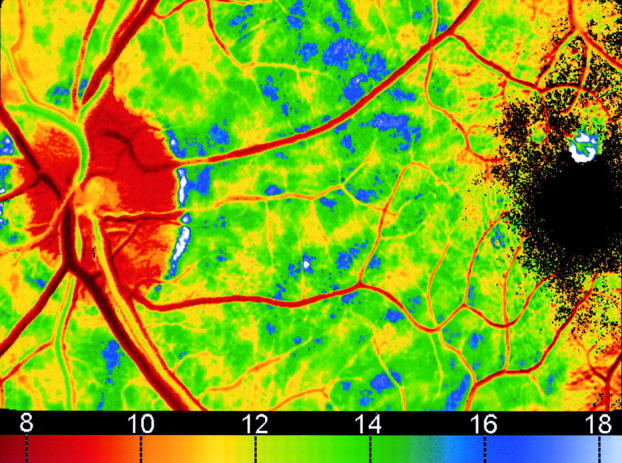
Parametric image in which the colour shows the time (in seconds) for the fluorescence to reach its maximum value. The patient has mild diabetic retinopathy.
Official websites use .gov
A
.gov website belongs to an official
government organization in the United States.
Secure .gov websites use HTTPS
A lock (
) or https:// means you've safely
connected to the .gov website. Share sensitive
information only on official, secure websites.
Parametric image in which the colour shows the time (in seconds) for the fluorescence to reach its maximum value. The patient has mild diabetic retinopathy.