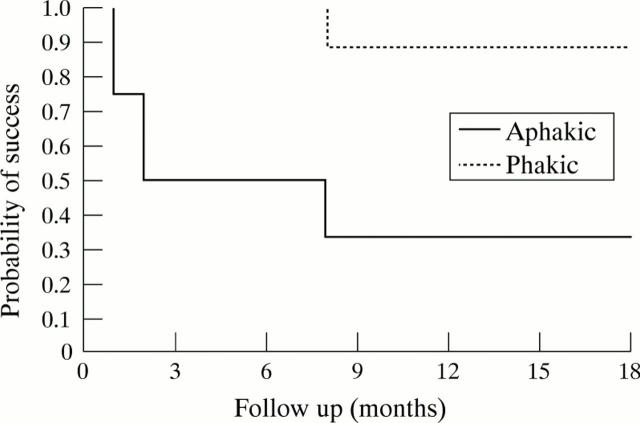
Figure 4 .
Probability of relative success at different follow up times according to lens status. The horizontal axis represents time since surgery (trabeculectomy with mitomycin C) and the vertical axis represents the probability of success, expressed as a percentage. Success was defined as no performance of or recommendation of further glaucoma surgery, and absence of severe complications associated with the filtering surgery.

