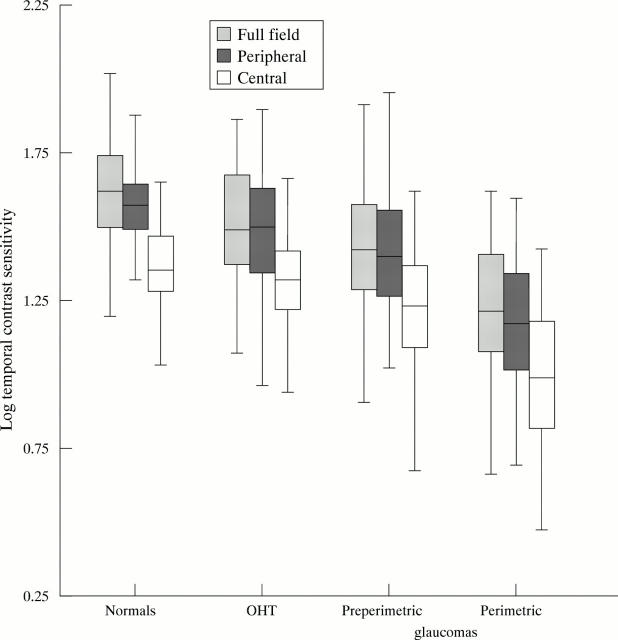
Figure 2 .
Box plots of temporal contrast sensitivity values determined with three different stimuli (full field, peripheral, and central flicker test) in four different subjects groups (OHT = ocular hypertensives). The temporal contrast sensitivity was almost equal with full field and peripheral, but significantly higher (p <0.001) than with central stimulation. The boxes include 50% of measured values (25% and 75% percentiles) and show the position of the median (horizontal line). Error bars indicate the 1.5-fold of the interquartile distance from the upper and lower box edges. The position of the medians (solid lines within the boxes) illustrates the markedly lower temporal contrast sensitivity with central compared with full field and peripheral stimulation. Additionally, it shows the decreasing temporal contrast sensitivity with increasing stage of glaucoma with all three stimulus areas.

