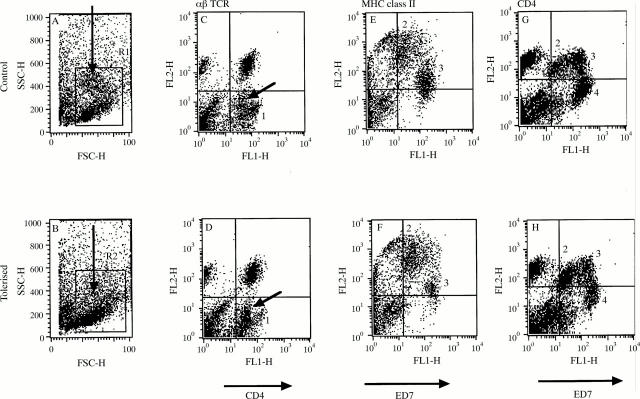
Figure 3 .
Flow cytometric analysis of retinal leucocytes in tolerised and control animals during EAU. Retinal leucocytes were isolated day 14 post immunisation The cells were derived from a pool of four eyes per experimental group, but comparable data were obtained in another identical experiment. Populations identified were based on two colour flow cytometric analysis including CD4 v αβTCR (CA and DC) and ED7 vMHC class II (BE and FD) and ED7 v CD4 (G and H)); see text. Plots A and B show scatter profile of retinal cell isolates demonstrating an increased population of granulocytes (arrow) in control animals (see text). Population 1 (plots C and D) identifies a CD4highαβ TCR- population in control animals (CD4 MFI of 110), distinct from CD4lowαβTCR- (arrow) population (CD4 MFI of 43), representing microglia (MG) and non-activated infiltrating macrophages.22 25 26 MG, further shown (population 2) on plots E-H and characterised by ED7low expression (see text), are equal in number (data not shown) and express similar MHC class II and CD4 between the two groups. Population 3 represent ED7high cells (granulocytes are excluded for calculation of macrophage numbers by appropriate backgating to scatter plot). Increased numbers of macrophages express MHC class II (plots E and F) and high levels of CD4 (plots G and H) in control animals (see text). E and F do not show granulocyte population whereas plots G and H include granulocytes (population 4) to show that they do not express CD4 and are markedly reduced in number in tolerised animals.

