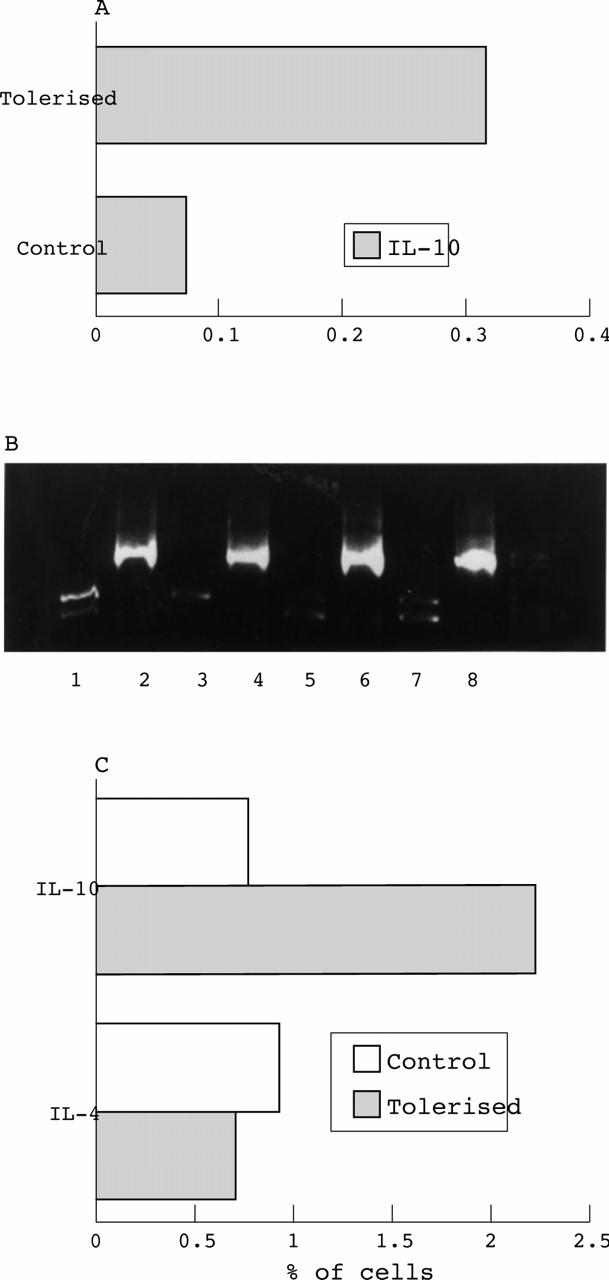
Figure 4 .

(A) RT-PCR cytokine analysis from eyes of control and tolerised animals during EAU. Values are from a representative experiment calculated from means of two animals/group at day 7 post immunisation each time point. (B) PCR IL-10 blots at day 7 post immunisation. Lanes 1 and 3, tolerised IL-10; lanes 2 and 4, tolerised β actin; lanes 5 and 7, control IL-10; lanes 6 and 8 control β actin. (C) Flow cytometric intracellular cytokine analysis day 7 post immunisation in control and tolerised animals. IL-10 expression represented as percentage of OX1+ cells. Values are mean of two animals/group.
