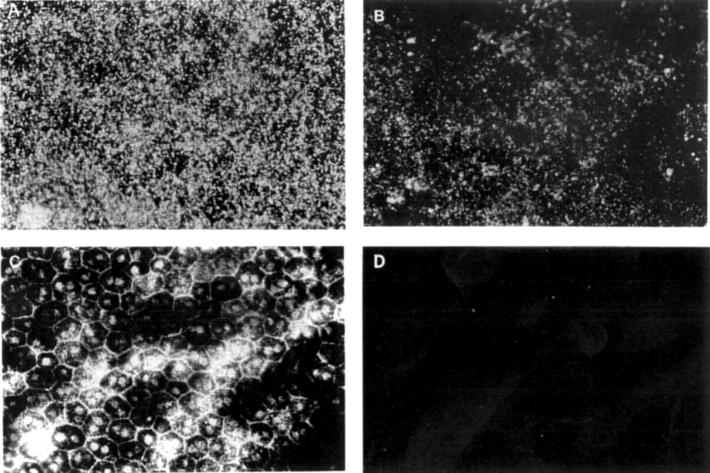
Figure 2 .
Distribution of fluorescently labelled PS-ODN (DS 012, 5.0 nmol) in the RPE cells by fluorescent microscopy of flat mounted RPE-choroid-sclera. (A) Two weeks after injection, the fluorescently labelled PS-ODNs appear as bright granules in the cytoplasm of the RPE cells. (B) Eight weeks after injection. (C) Microphotograph of the hexagonal RPE cells in (A), observed by light microscopy. (D) A control eye injected with 5.0 nmol of sodium fluorescein, 2 week after injection. Original magnification (A-D) ×100.

