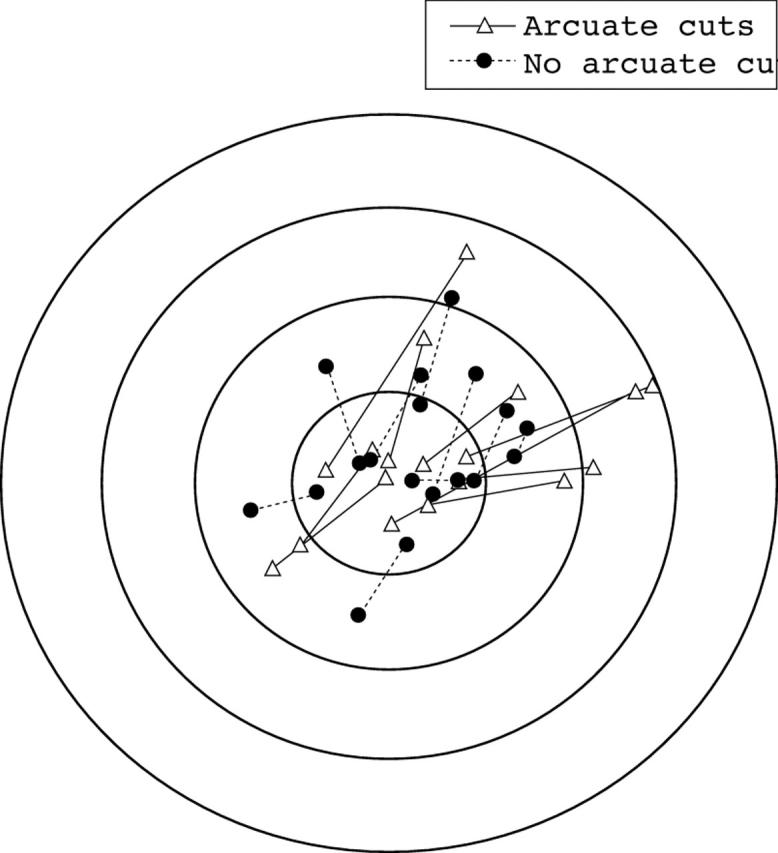
Figure 5 .

Doubled angle plot of preoperative and postoperative astigmatism. Each concentric circle represents 5D astigmatism magnitude. The lines join the preoperative and postoperative values for a single eye. The ideal plot would have lines radiating from the centre like a cartwheel.
